Error log triage agent
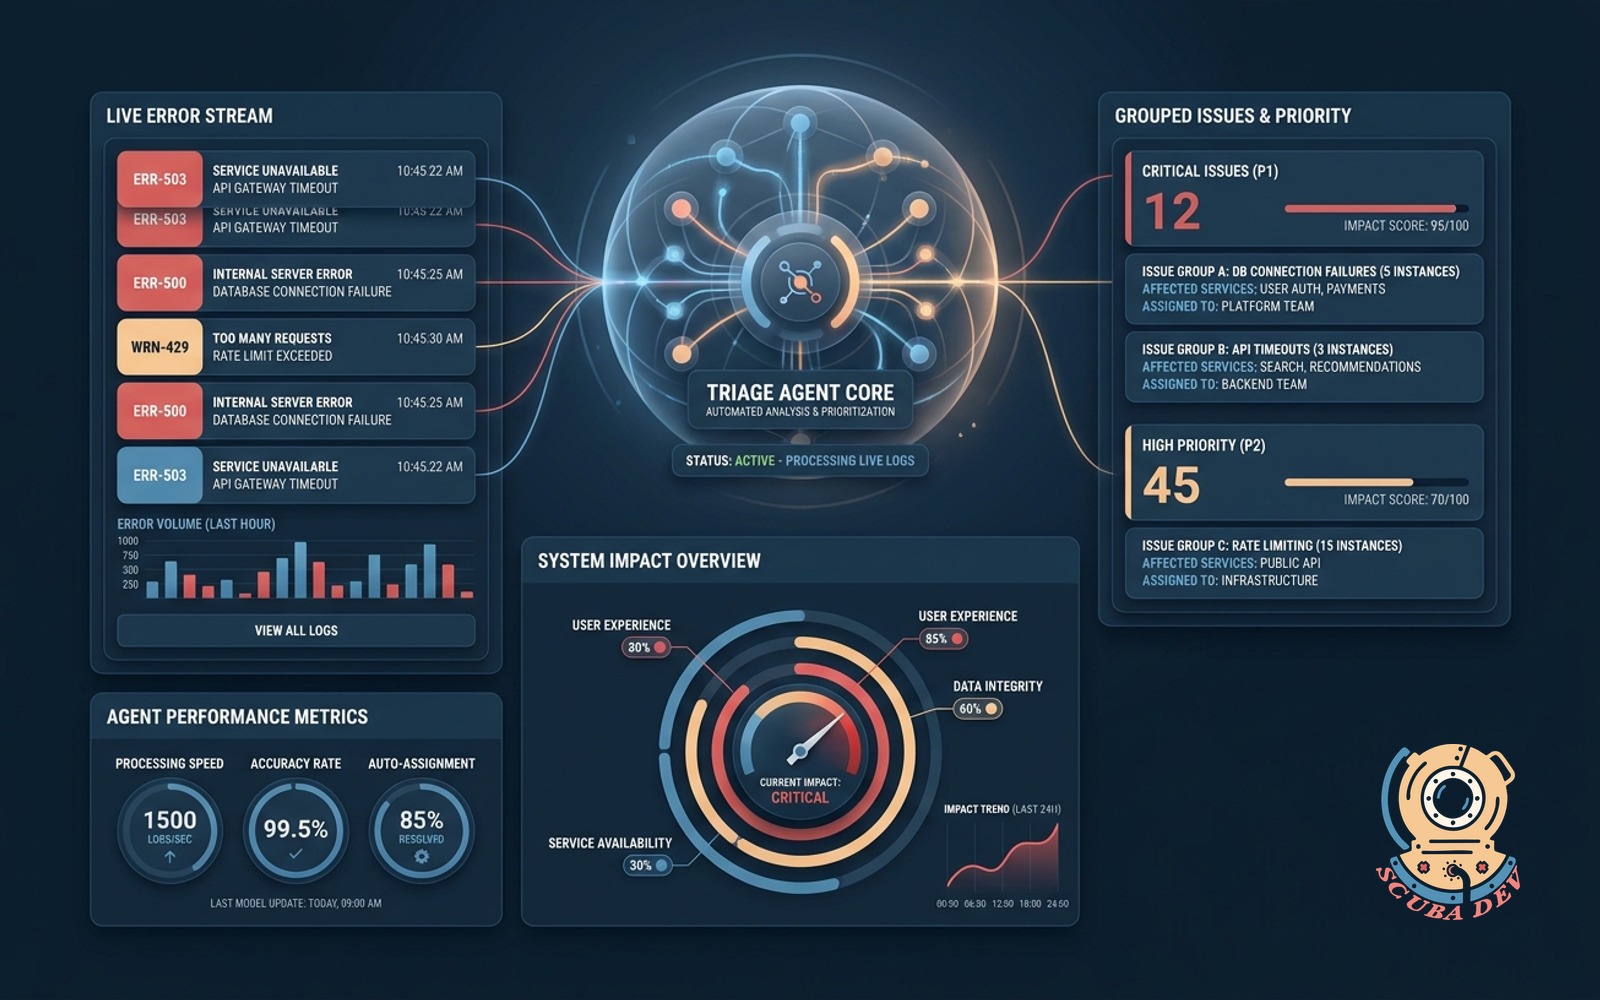
This agent automatically reviews your application error logs to group related issues and assign priority levels based on system impact.
Possibilities
Where this could go
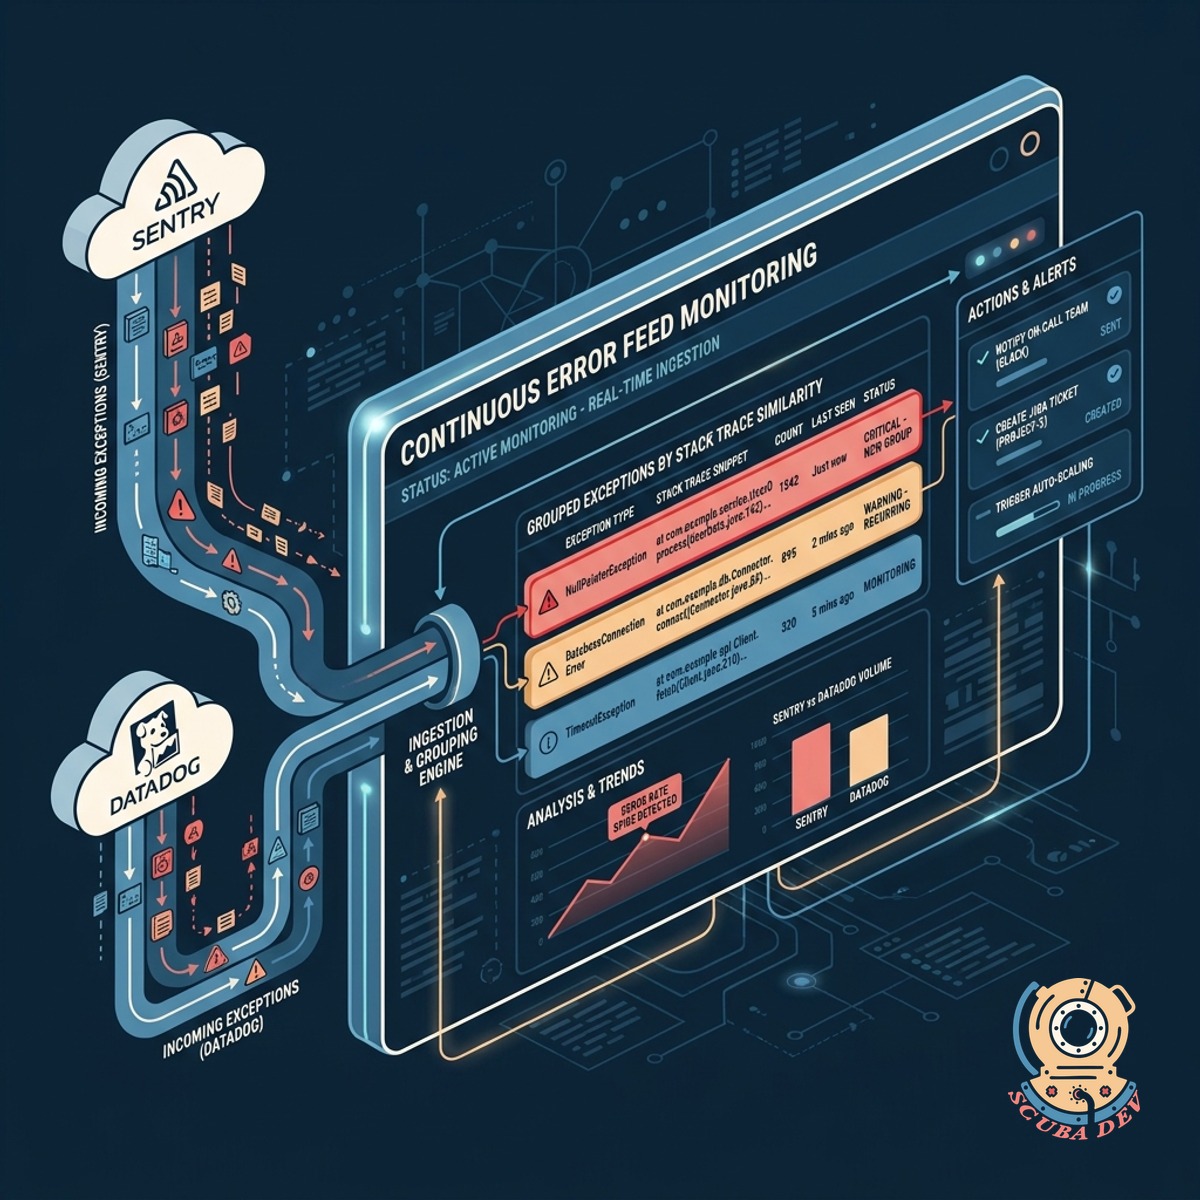
Automated Error Deduplication And Grouping
The agent scans incoming log streams to identify and group identical or related errors into a single actionable event.
- Compares stack traces to find root cause similarities
- Groups recurring errors to prevent alert fatigue
- Tags grouped events with the affected microservice
- Updates the event timeline as new instances occur
Contextual Priority Scoring For Alerts
We evaluate each error against your system architecture to assign a severity score based on user impact and service dependency.
- Analyzes error frequency and user traffic patterns
- Flags critical failures in payment or authentication flows
- Downgrades priority for known background job timeouts
- Attaches system context to the alert payload
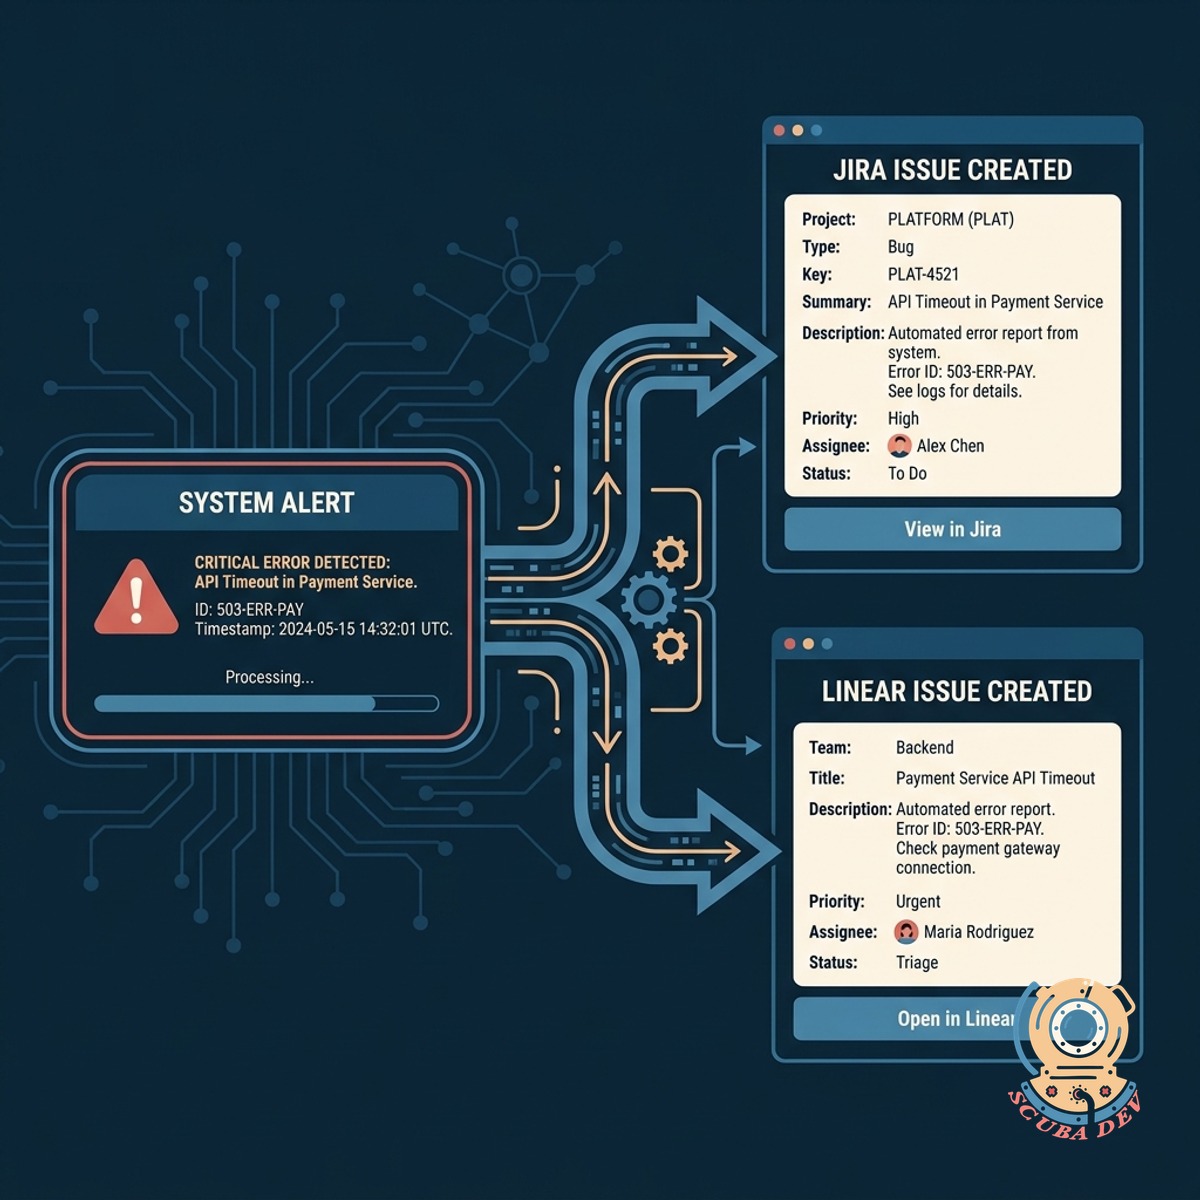
Direct Issue Tracker Integration
You can connect the agent directly to your project management tools to automatically create and assign tickets for new errors.
- Formats error details into standard bug report templates
- Syncs status updates between the log tool and issue tracker
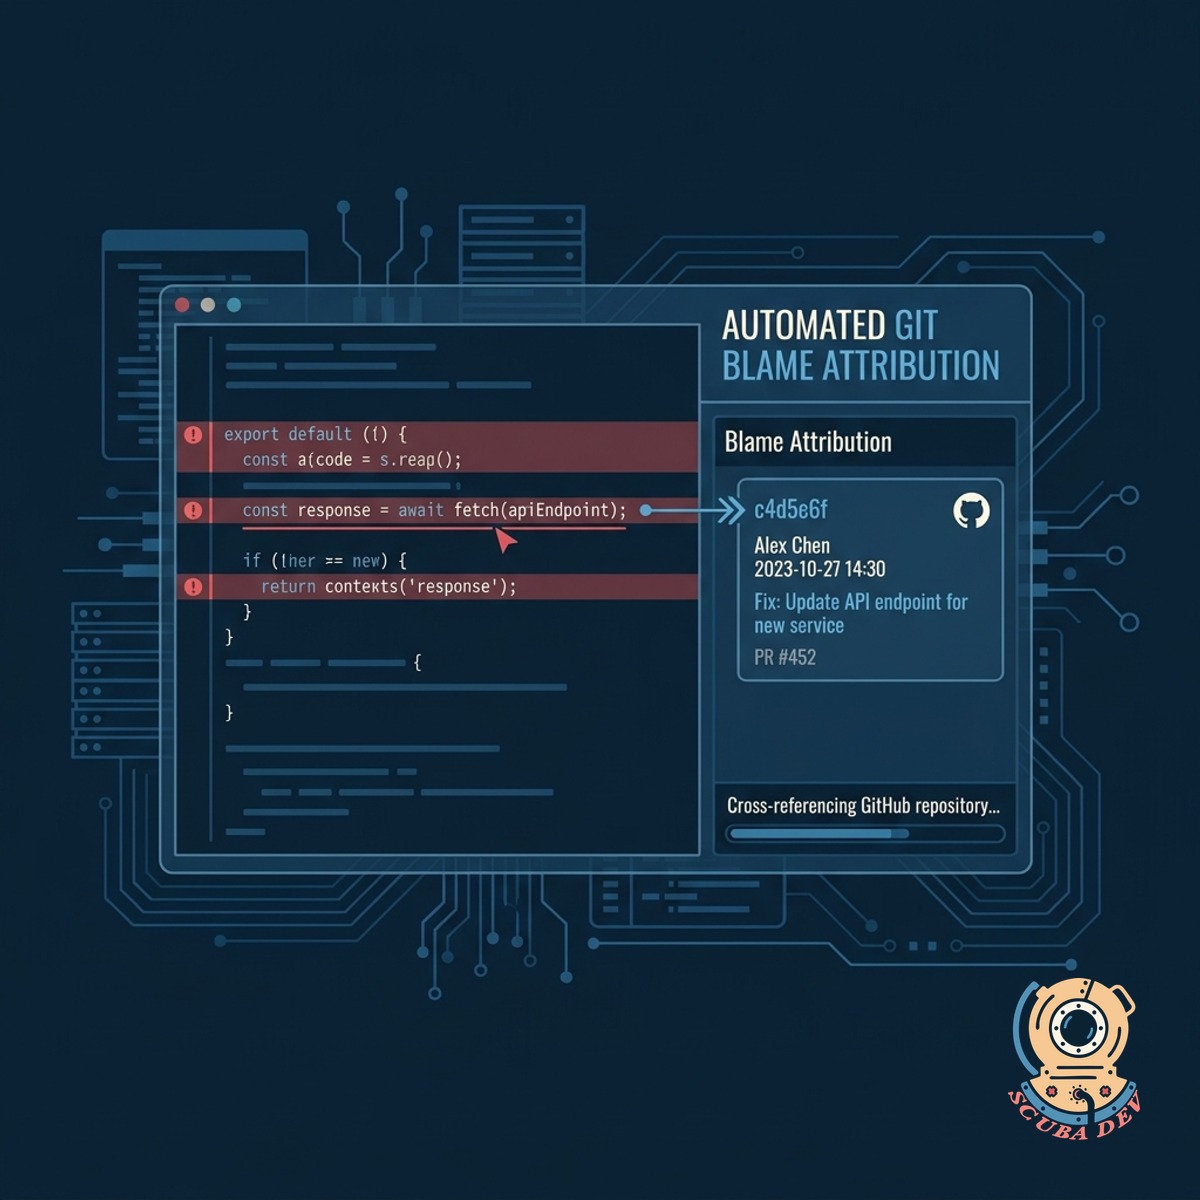
- Assigns tickets to the developer who owns the affected service
- Attaches relevant log snippets and stack traces to the ticket
Questions
Things people ask
Which logging platforms do you support?
We integrate with standard logging providers like Datadog, Splunk, and AWS CloudWatch. You can also send logs directly to our ingestion API using standard JSON formats.
How does the agent determine which errors are related?
The agent looks at the stack trace, error message, and originating service. It uses pattern matching to group errors that share the same root cause, even if the specific user data in the log differs.
Can we customize the priority scoring rules?
Yes. You can define custom rules based on specific error codes, affected endpoints, or service names. This ensures the agent aligns with your internal definitions of critical severity.
Will this tool delete or alter our original logs?
No. The agent only reads your log streams and creates metadata for grouping and routing. Your original log data remains untouched in your primary storage system.
What happens if the agent encounters an unfamiliar error format?
Unrecognized formats are placed in a default unassigned queue for manual review. You can then map the new format in your settings so the agent handles it correctly next time.
How do we map specific services to our developers?
You can upload a service ownership registry or connect your existing incident response schedule. The agent uses this mapping to assign tickets to the correct team or individual.
Can we review the tickets before they are assigned?
We encrypt all log data in transit and at rest. You can also configure the agent to mask sensitive fields like passwords or personal identification numbers before processing.