Feature adoption funnel
For any feature, shows who discovered it, tried it, and kept using it. Segments by plan and persona.
Possibilities
Where this could go
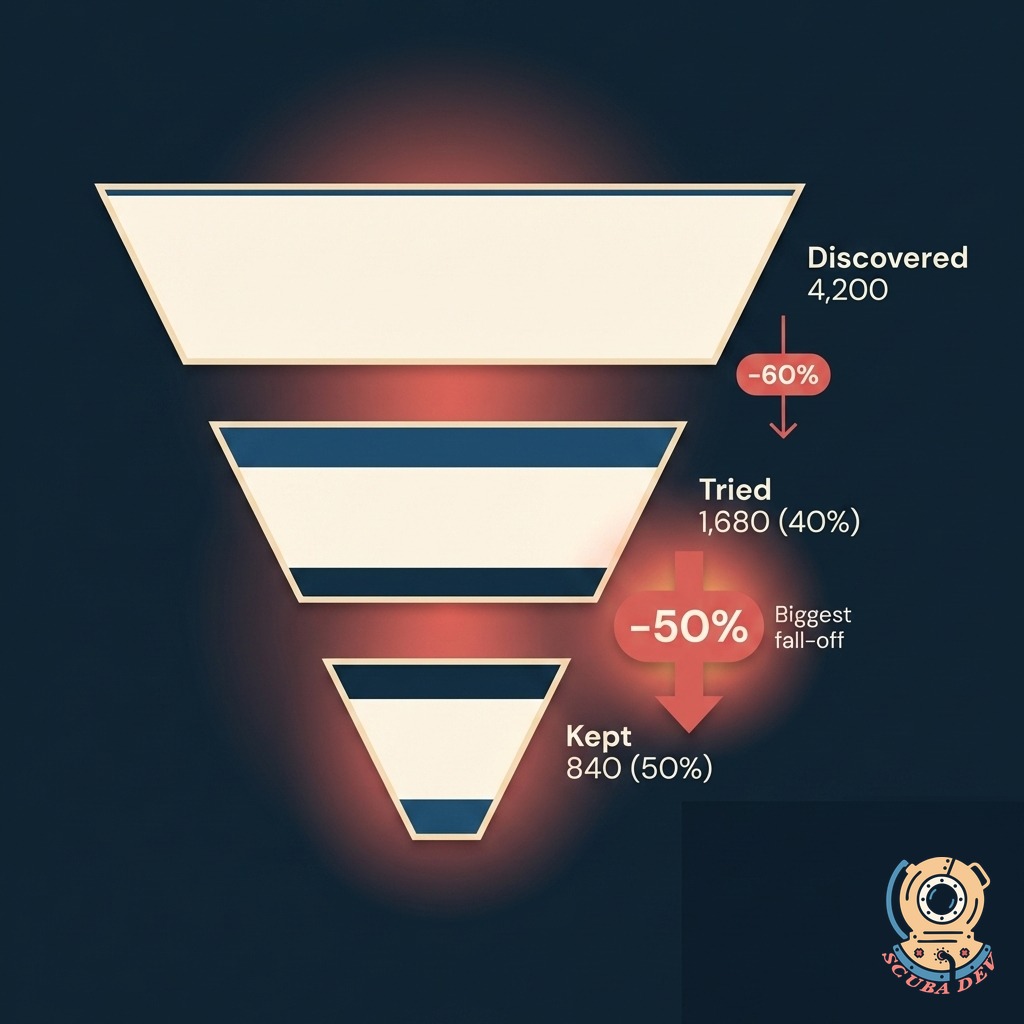
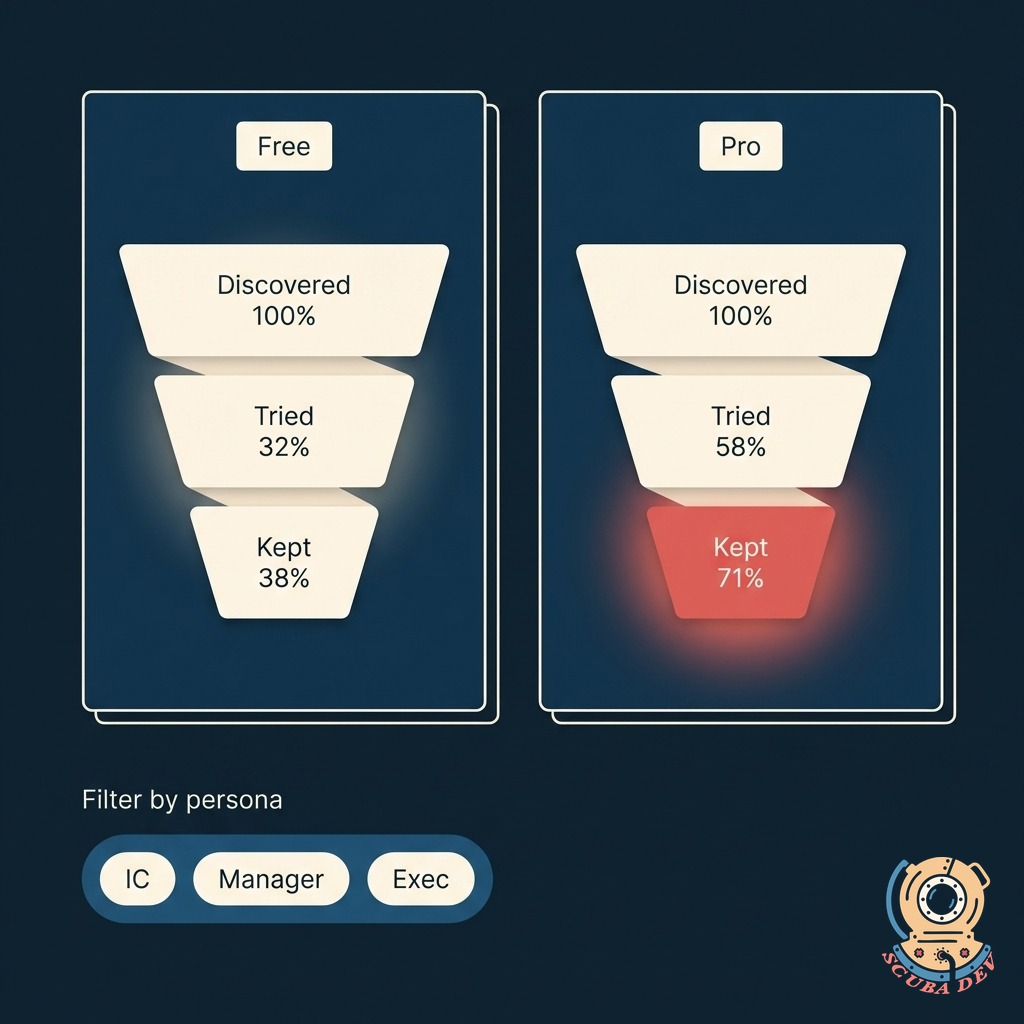
Discovered, Tried, Kept
Three clear stages per feature. See where users fall off and by how much, so you know where to invest.
- Discovered = any user who saw the feature in-product
- Tried = user who interacted at least once
- Kept = user who returned and used it in the next 14 days
- Drop-off percentage shown between each stage
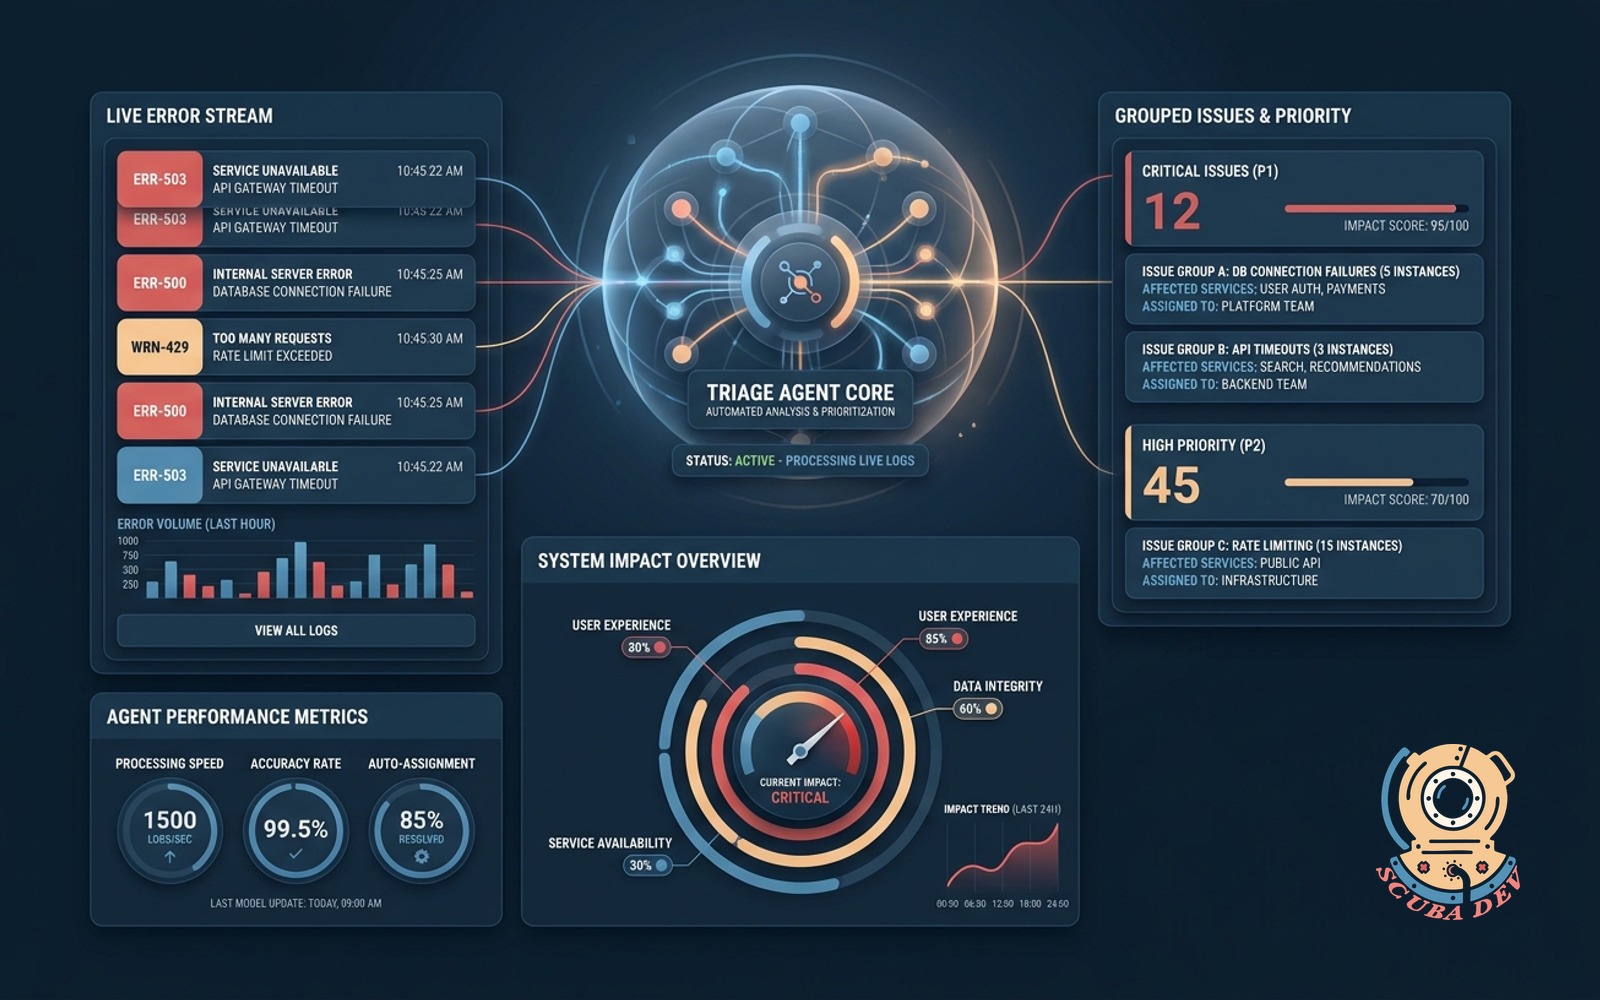
Segmented By Plan And Persona
Split the funnel by tier, persona, company size, or any attribute your product sends. Find the users who love the feature and the ones who do not.
- Plan tiers (free, pro, enterprise) shown as parallel funnels
- Persona segments (IC, manager, exec) shown side by side
- Company size, region, signup source, and custom traits all supported
- Compare any two segments with one click
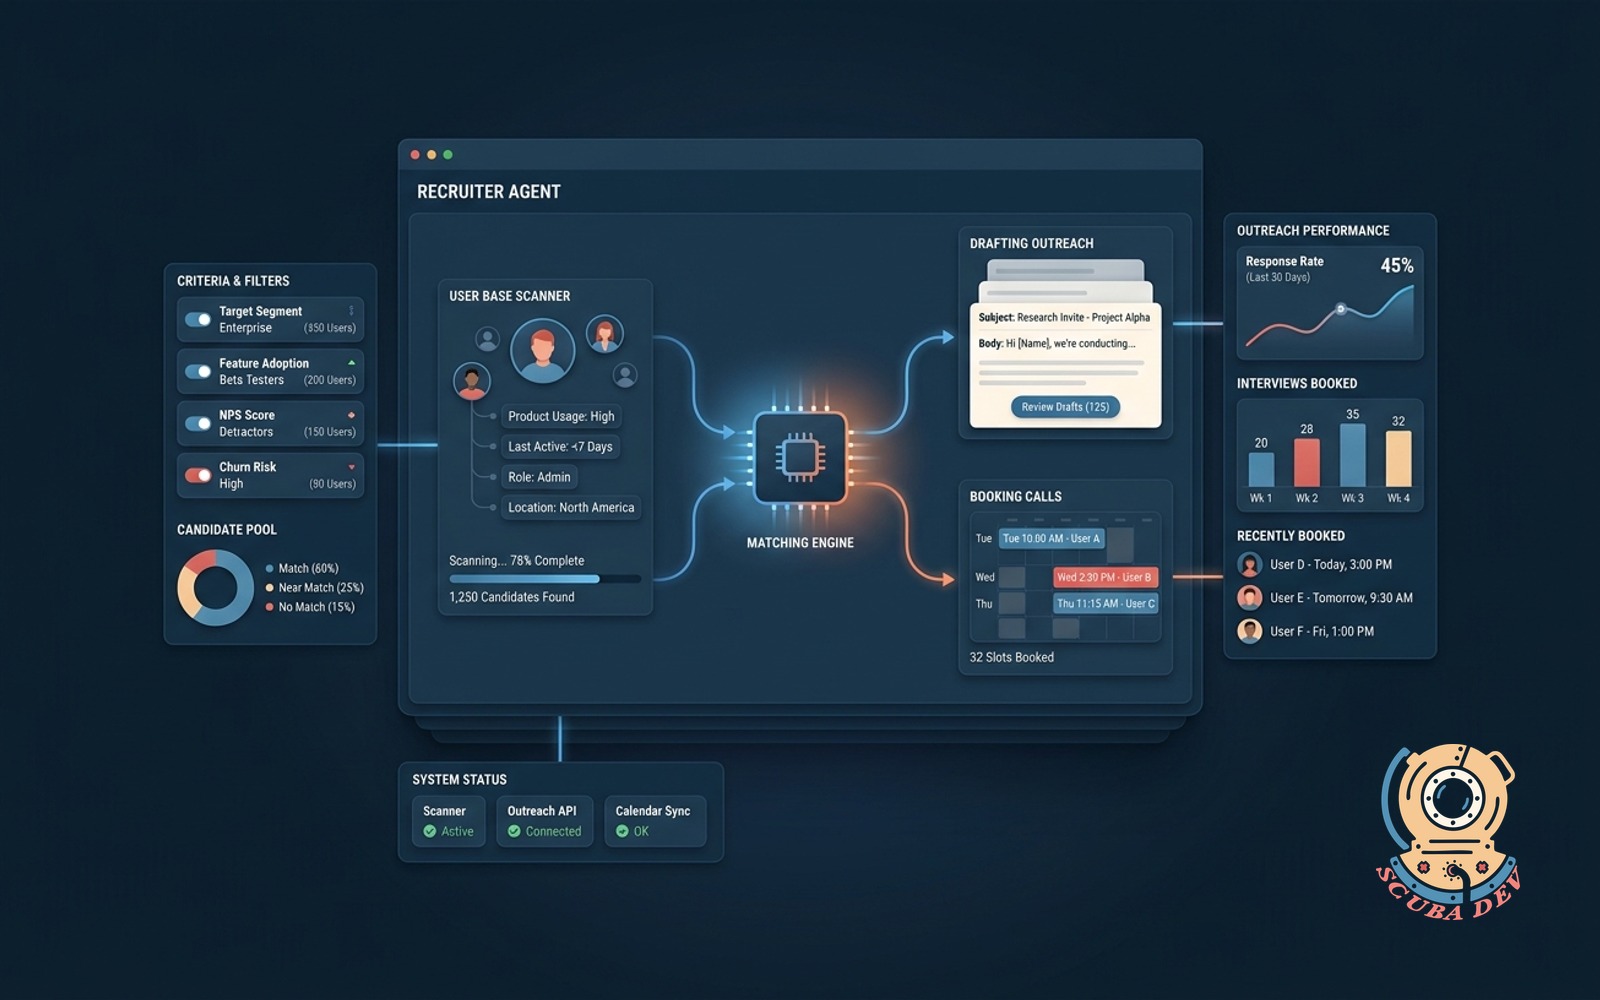
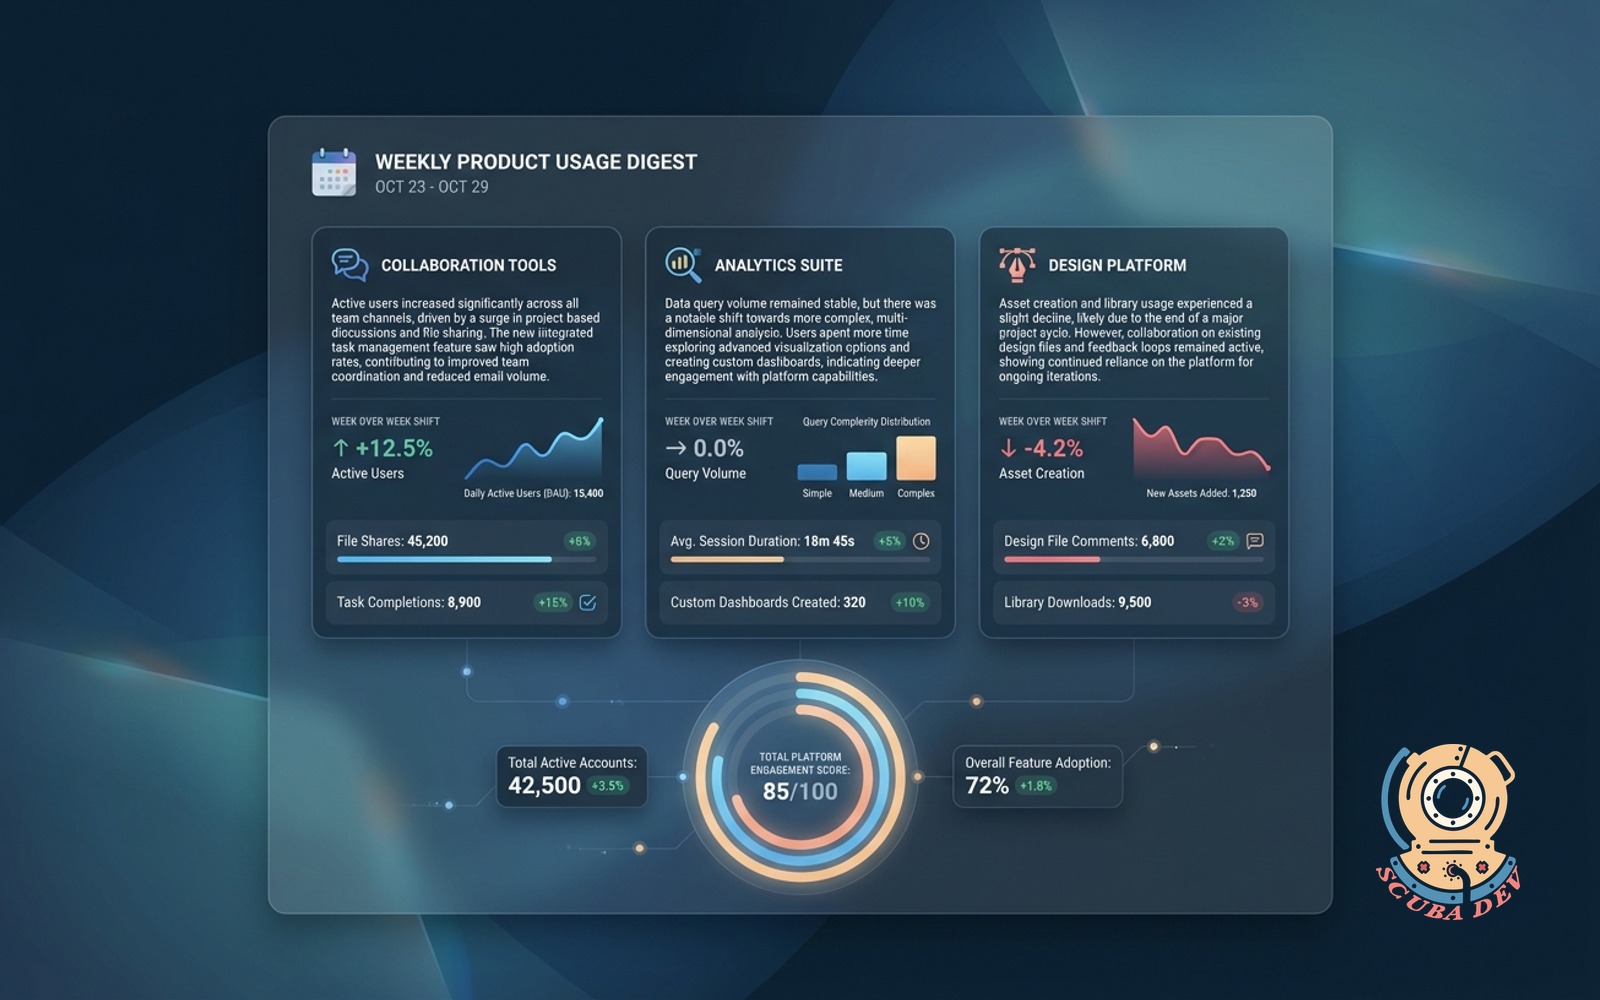
Flags The Moves That Matter
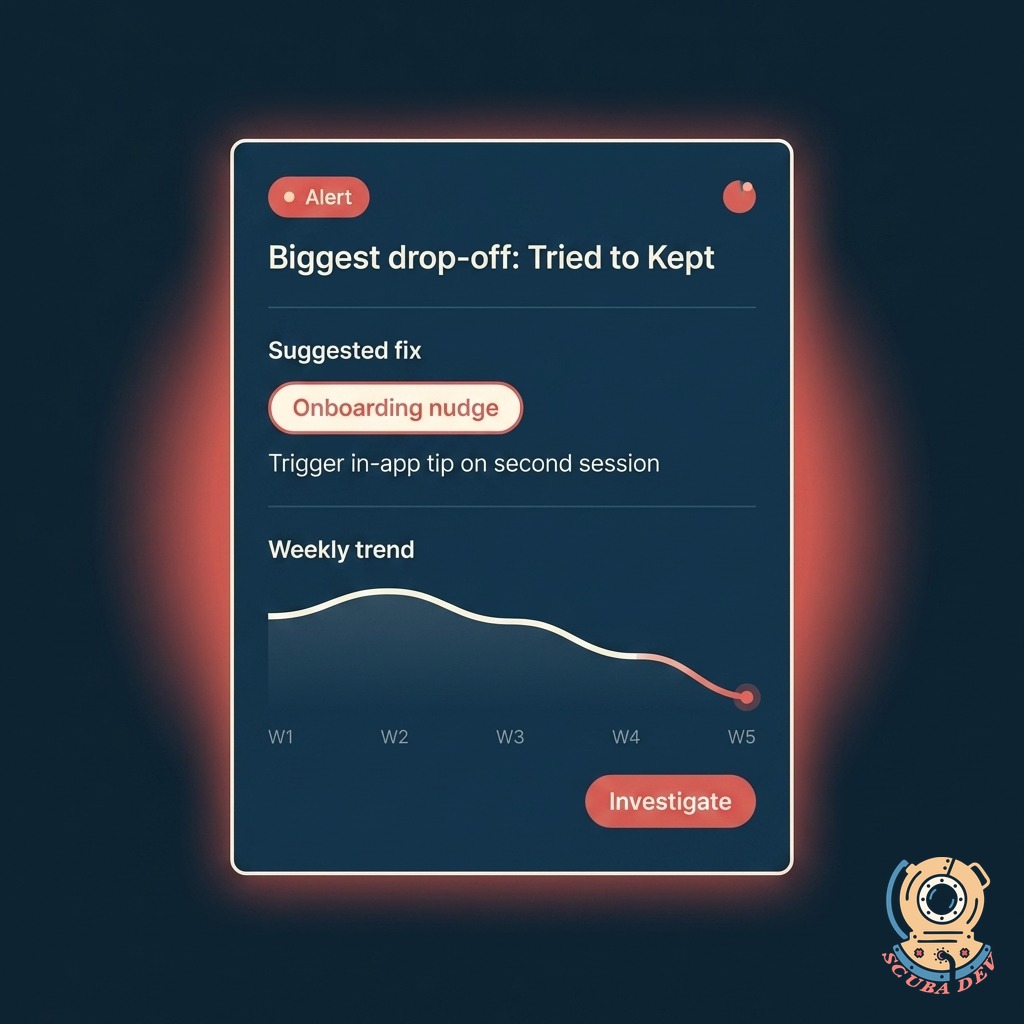
Surfaces the biggest drop-off and the segments that need the most help. Suggests what to fix: onboarding, empty state, positioning, or pricing.
- Biggest drop-off called out with a coral alert
- Suggested fix area (onboarding, empty state, nudge copy, pricing placement)
- Benchmark against your other features
- Weekly digest lands in Slack or email
Questions
Things people ask
What analytics tools do you connect to?
Mixpanel, Amplitude, Heap, PostHog, Segment, Snowplow, and custom event pipelines. We also pull from backend event tables directly if your product sends events to a warehouse.
How do you define discovered versus tried?
You define the events during setup. Discovered usually means a feature-viewed event, tried means a core-action event, kept means a return event within your chosen window. We help you pick events that make sense for each feature.
Can we track legacy features too?
Yes. If the events exist in your data, the funnel works. For features without proper instrumentation, we help you add the missing events or infer from proxy signals like clicks, page visits, or API calls.
How often does the funnel refresh?
Hourly by default, with on-demand refresh available. Segment comparisons and cohort analyses recalc overnight. You can trigger an immediate refresh from the dashboard after a launch.
Can we compare cohorts over time?
Yes. Pick any two time windows and compare the funnels side by side. See if onboarding changes moved the needle, if a pricing test changed retention, or if a new persona adopts differently.
Does this replace our BI tool?
No. It is a focused view of feature adoption built for product managers. Your BI tool still owns the broader analytics. Exports and dashboards can feed into your BI layer.
How do the suggested fixes get generated?
You map your existing product events to the three funnel stages in our settings dashboard. We track those events automatically and build the funnel retroactively. There is no need to write new code if you already send us your product analytics.