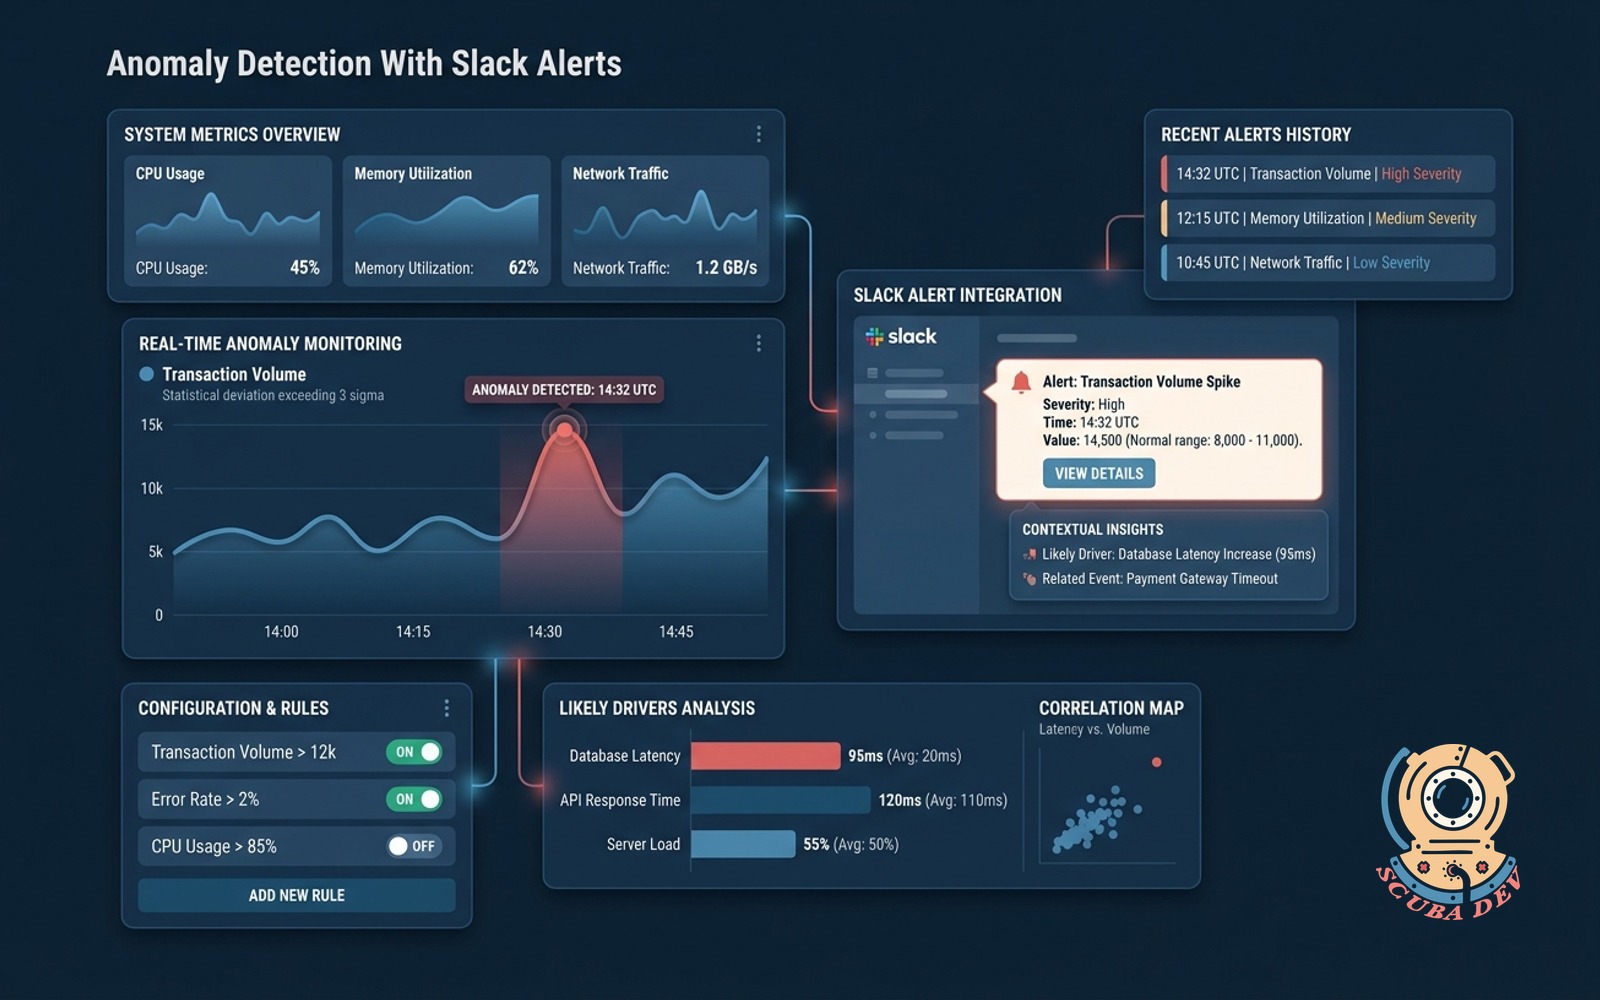
Anomaly Detection With Slack Alerts
Watches key metrics, fires Slack alerts on statistical anomalies, and adds context on likely drivers.
Possibilities
Where this could go
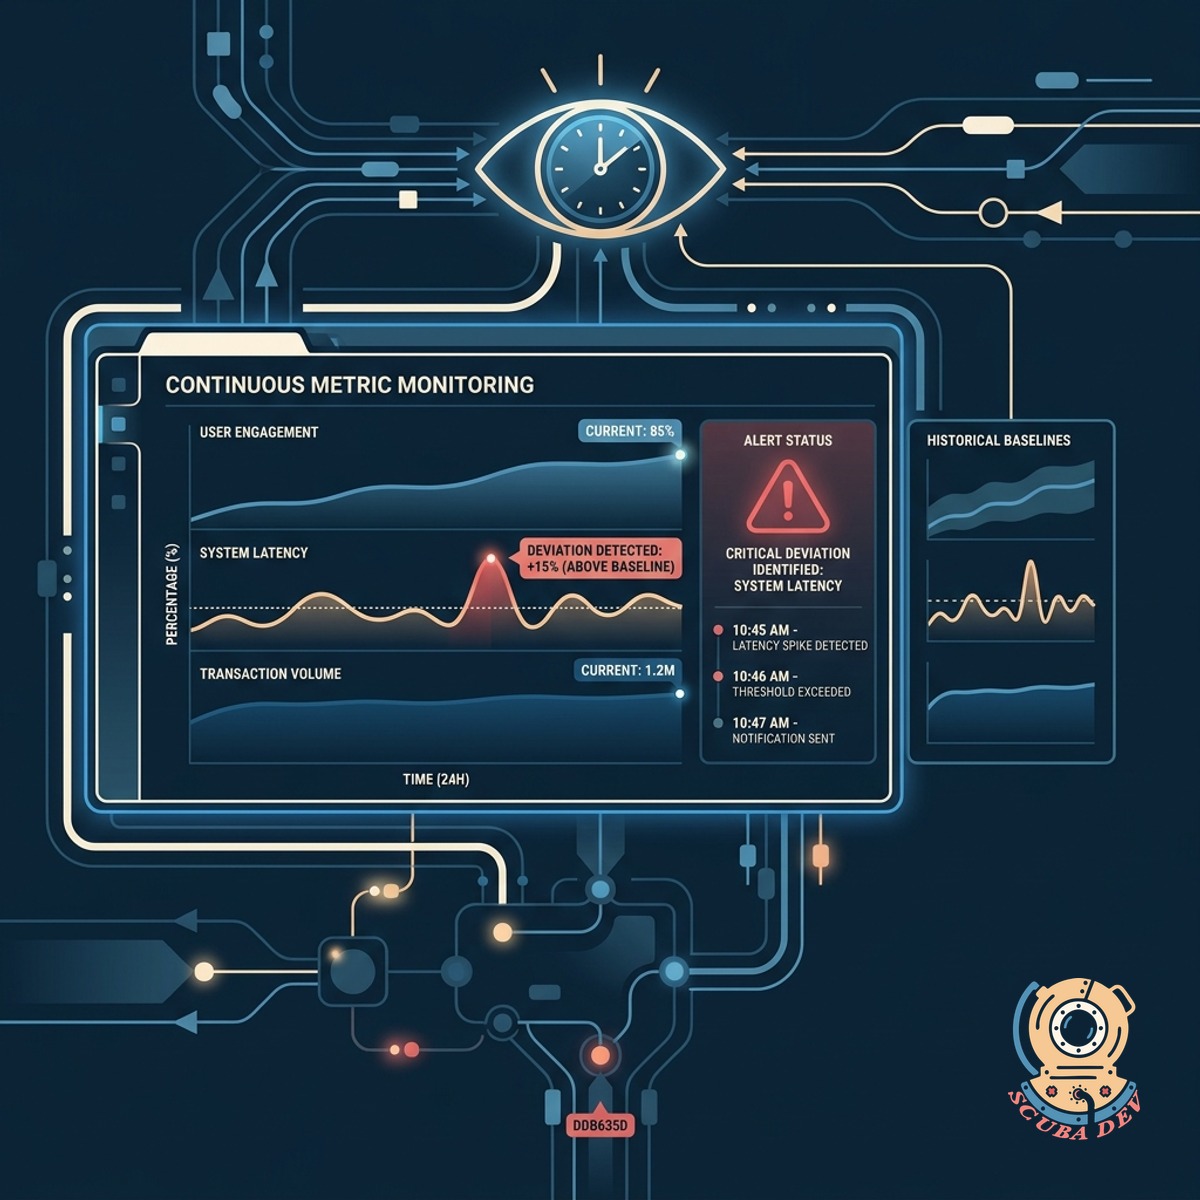
Continuous Statistical Metric Monitoring
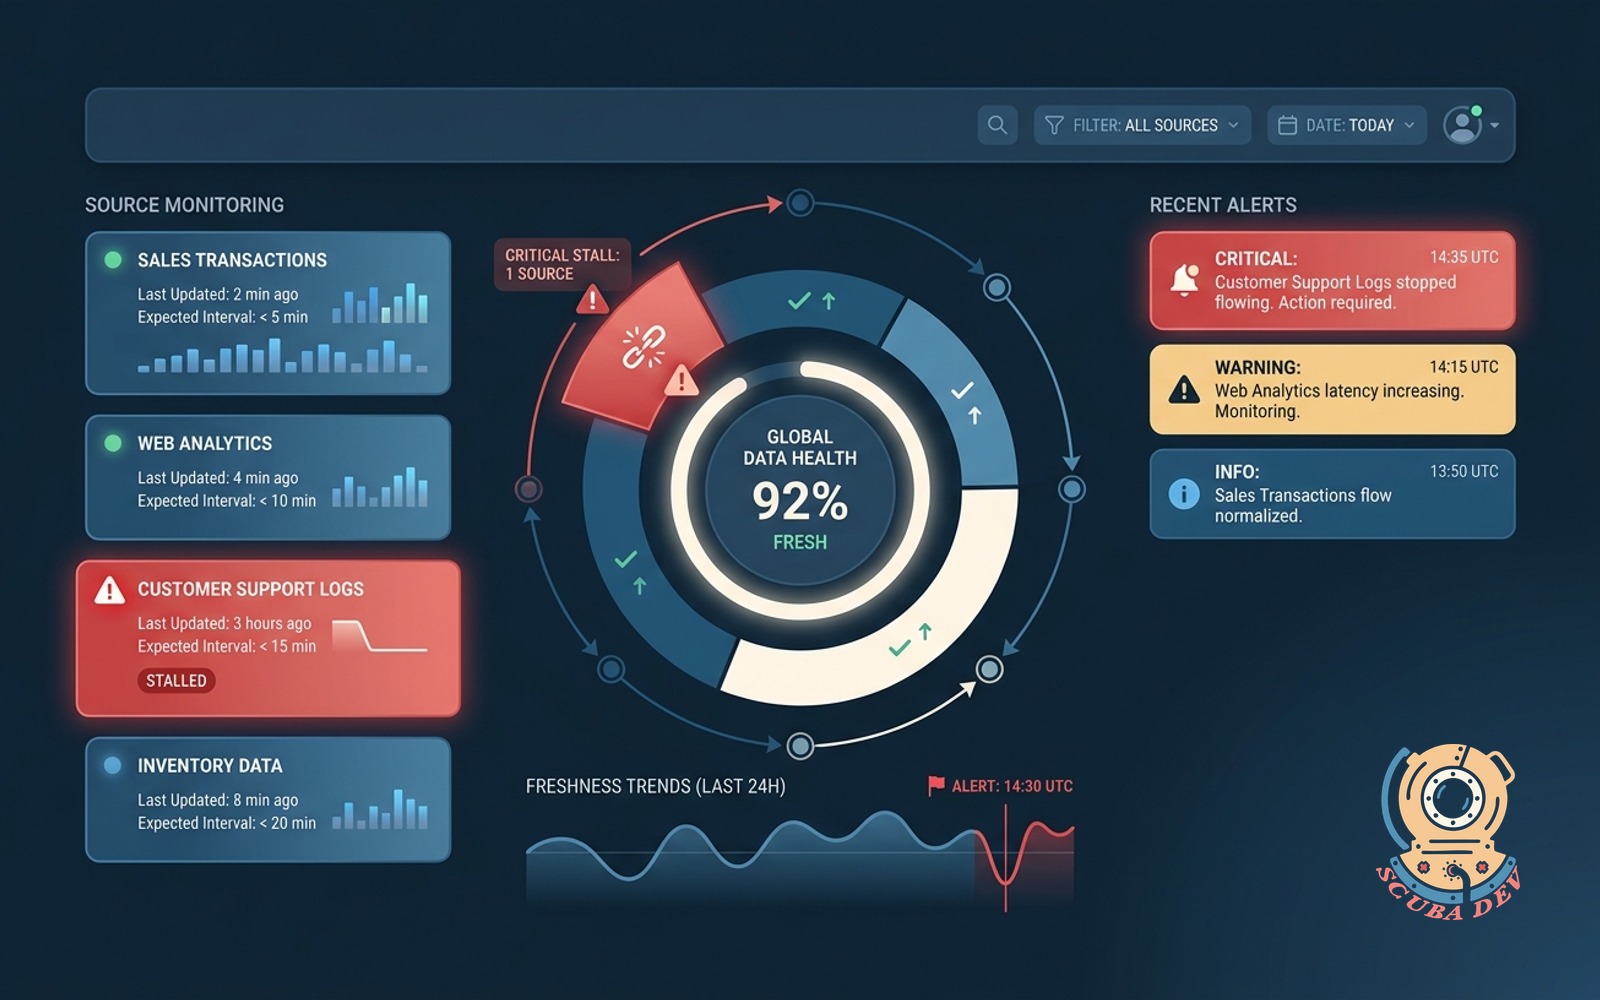
The system watches your key performance indicators around the clock and identifies deviations from historical baselines.
- Connects to existing databases
- Establishes historical baselines
- Identifies statistical outliers
- Runs continuously in the background
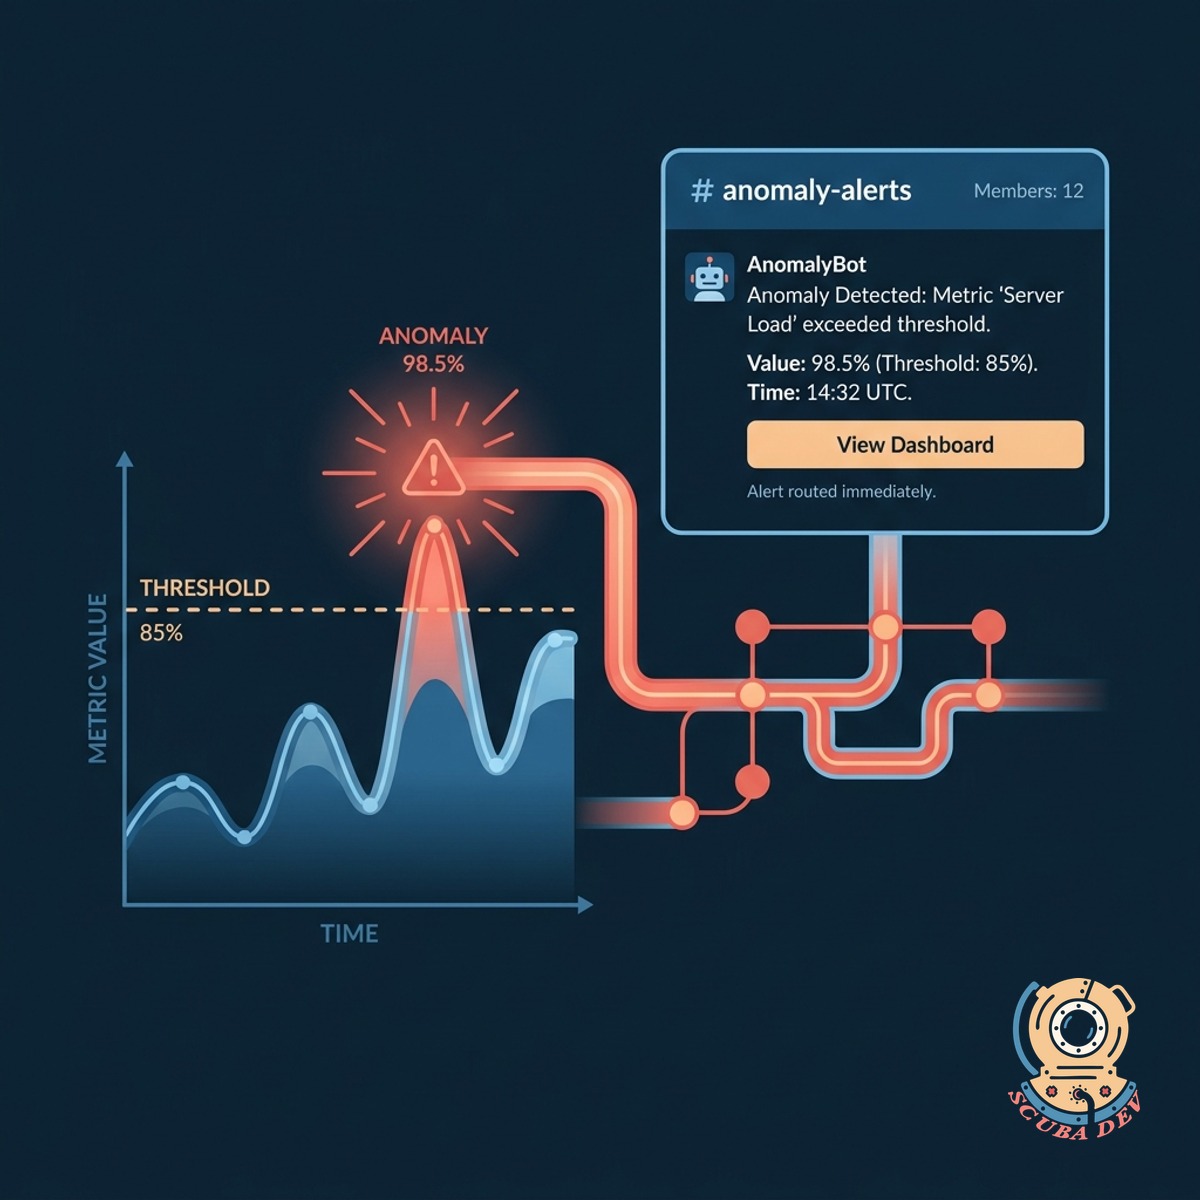
Automated Slack Notifications For Anomalies
When a metric crosses an anomaly threshold, the system immediately routes an alert to the designated Slack channel.
- Integrates directly with Slack
- Routes to specific channels
- Tags relevant team members
- Includes direct links to data
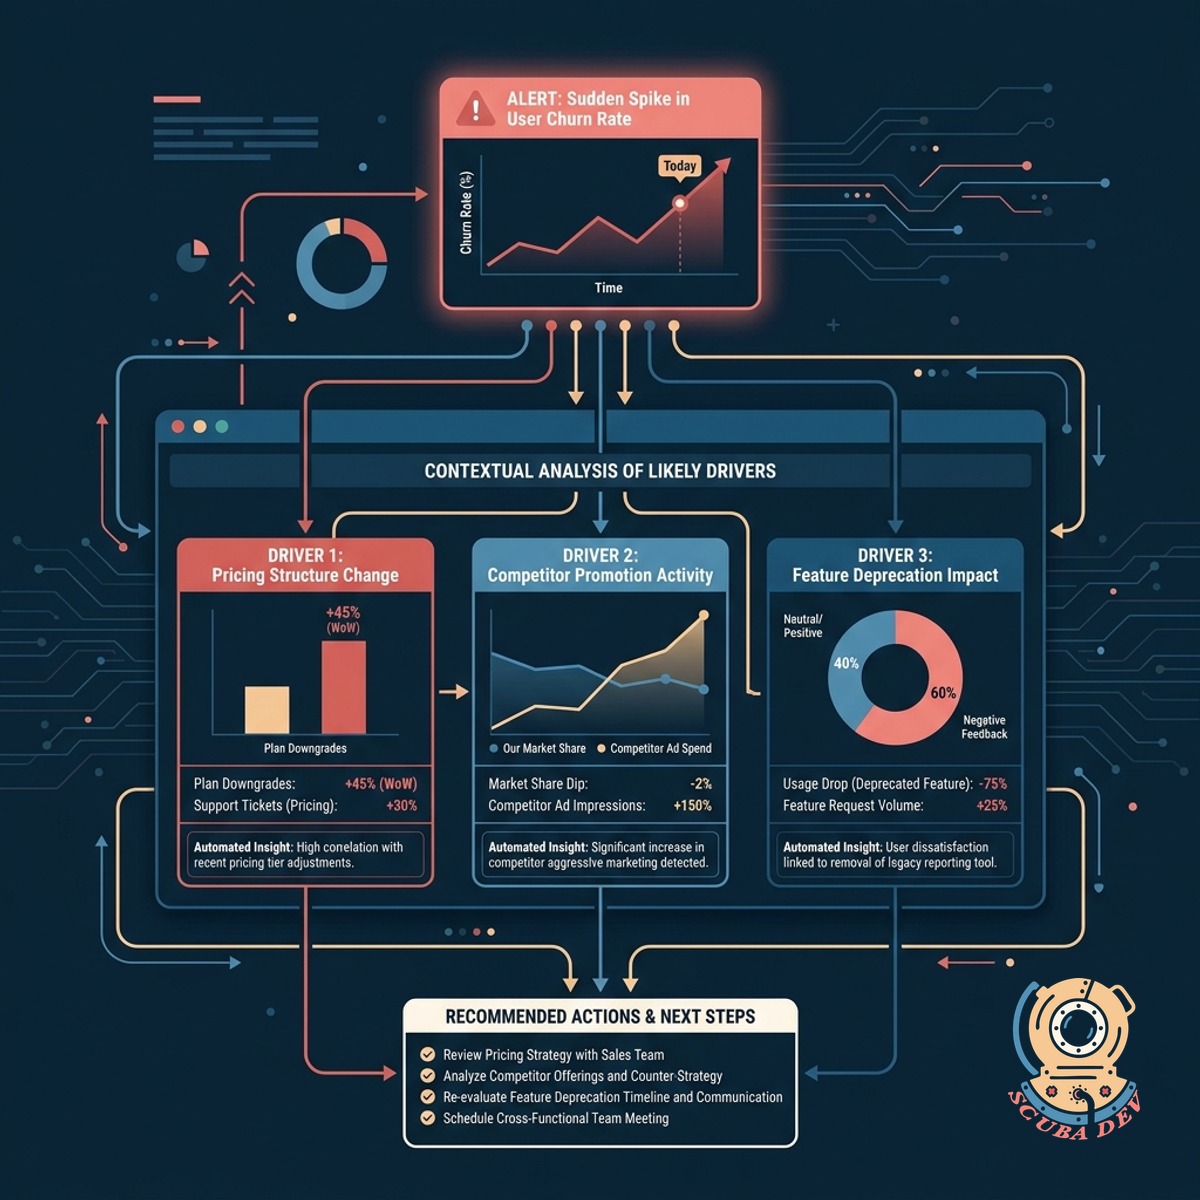
Contextual Analysis Of Likely Drivers
Each alert includes an automated analysis of related metrics to help your team understand what caused the sudden change.
- Correlates related data points
- Highlights contributing factors
- Reduces manual investigation time
- Formats data for quick reading
Questions
Things people ask
What data sources can this system monitor?
We can connect the anomaly detection engine to tools like Google Analytics, Mixpanel, Datadog, Snowflake, and custom PostgreSQL databases.
How does the system define an anomaly?
The tool uses statistical models to establish a baseline of normal behavior for your metrics and flags data points that fall outside the expected confidence intervals.
Can we control which Slack channels receive alerts?
Yes. You can configure routing rules so that marketing anomalies go to the marketing channel while technical errors go to the engineering team.
How does the tool determine the likely drivers of an anomaly?
When a primary metric spikes or drops, the system automatically checks secondary metrics and dimensions to see which segments contributed most to the overall change.
Will this create too much noise in our Slack workspace?
We implement sensitivity thresholds and cooldown periods to ensure your team only receives alerts for significant deviations rather than minor fluctuations.
Do we need an existing data warehouse to use this?
While a data warehouse like BigQuery or Redshift is helpful for complex analysis, we can also build this directly on top of your application database or third party APIs.
Can we adjust the sensitivity of the alerts?
Your team can manually adjust the statistical confidence levels for each metric to make the detection more or less strict based on your specific operational needs.