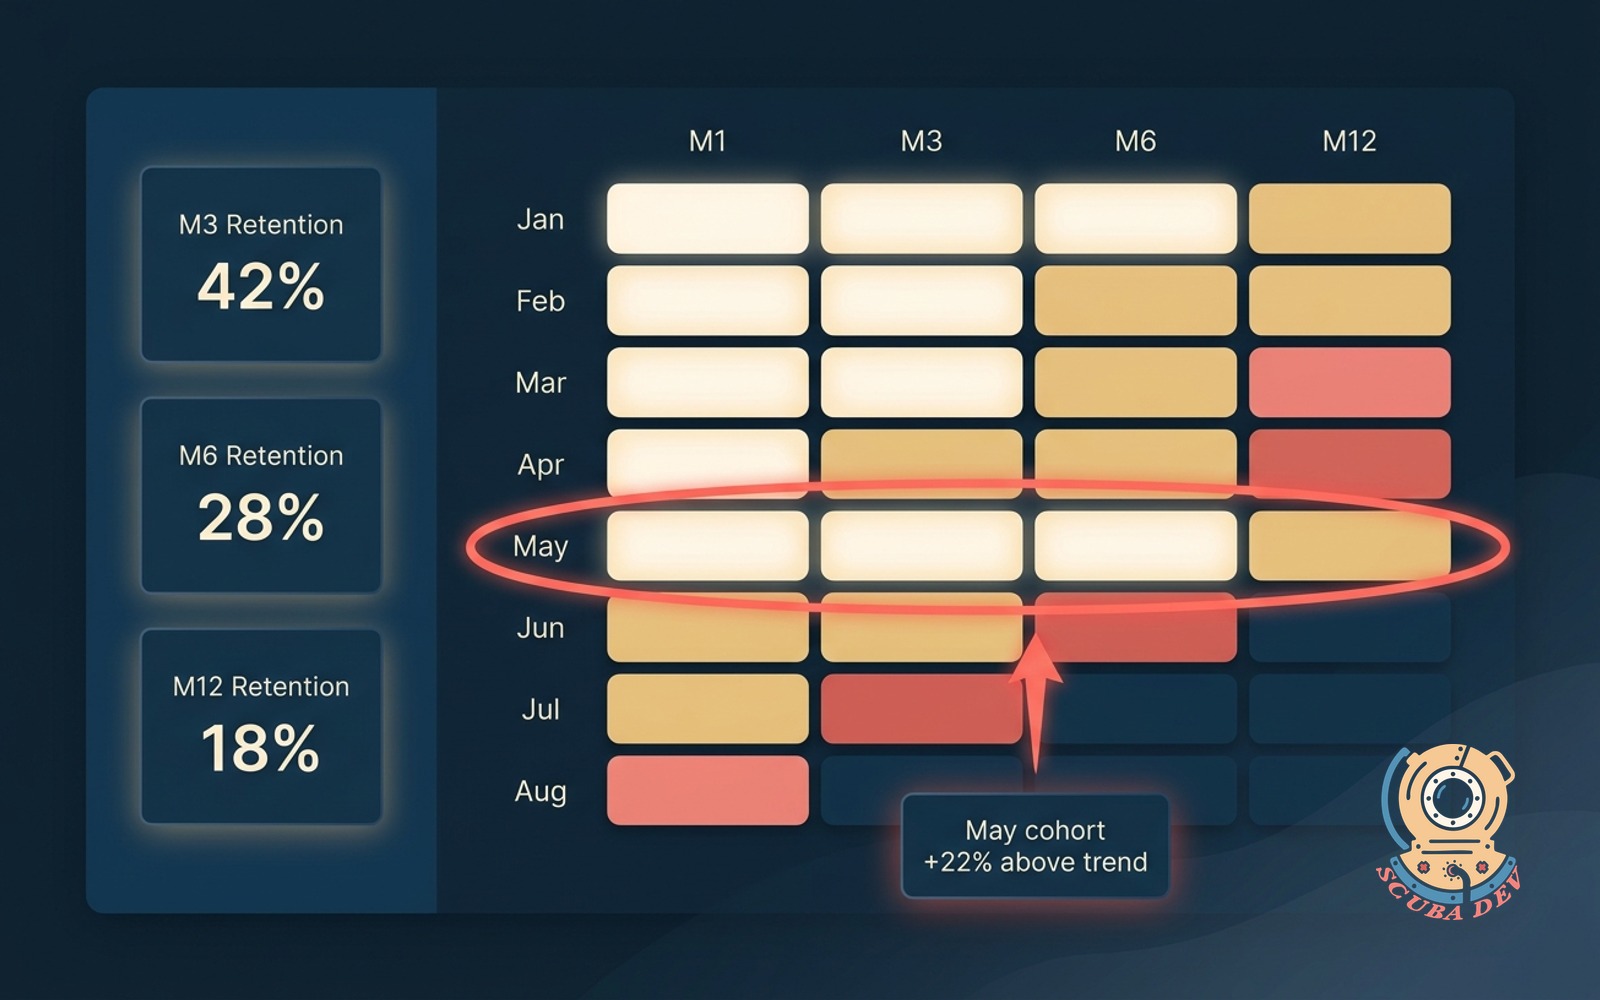
Cohort retention board
Groups customers by signup month and plots retention over time. Highlights the cohorts that break the trend.
Possibilities
Where this could go
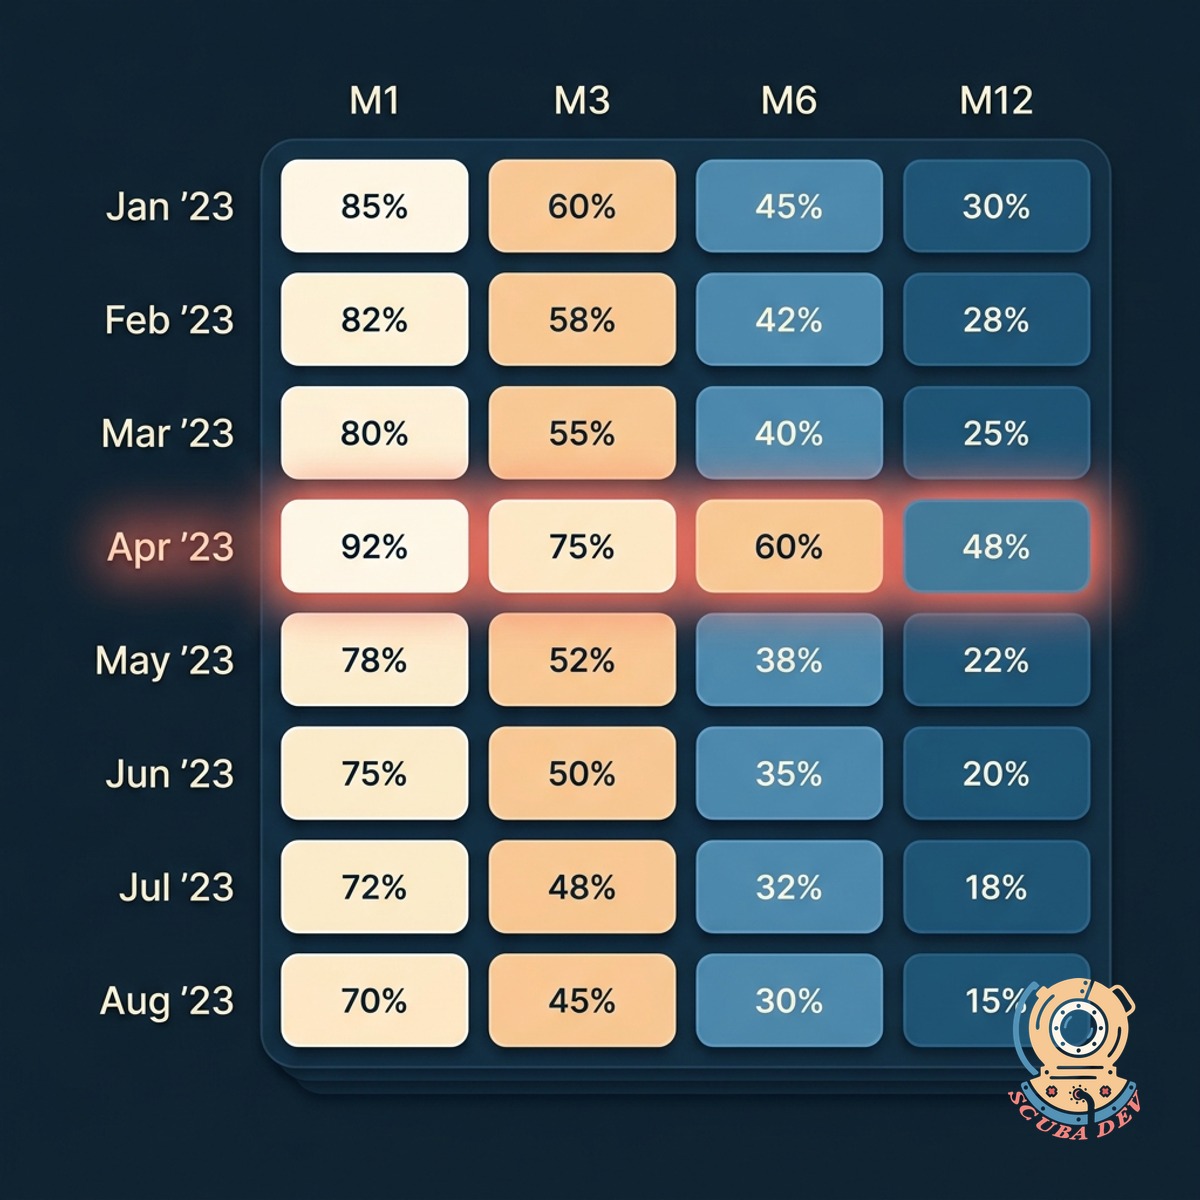
Grouped By Signup Month
Every new customer drops into a cohort based on the month they signed up. The board tracks each cohort month by month, so you see who sticks and who drifts.
- Auto-groups every customer by signup month
- Retention measured at month 1, 3, 6, and 12
- Filter cohorts by plan tier, segment, or acquisition channel
- Raw retention and weighted by revenue both available
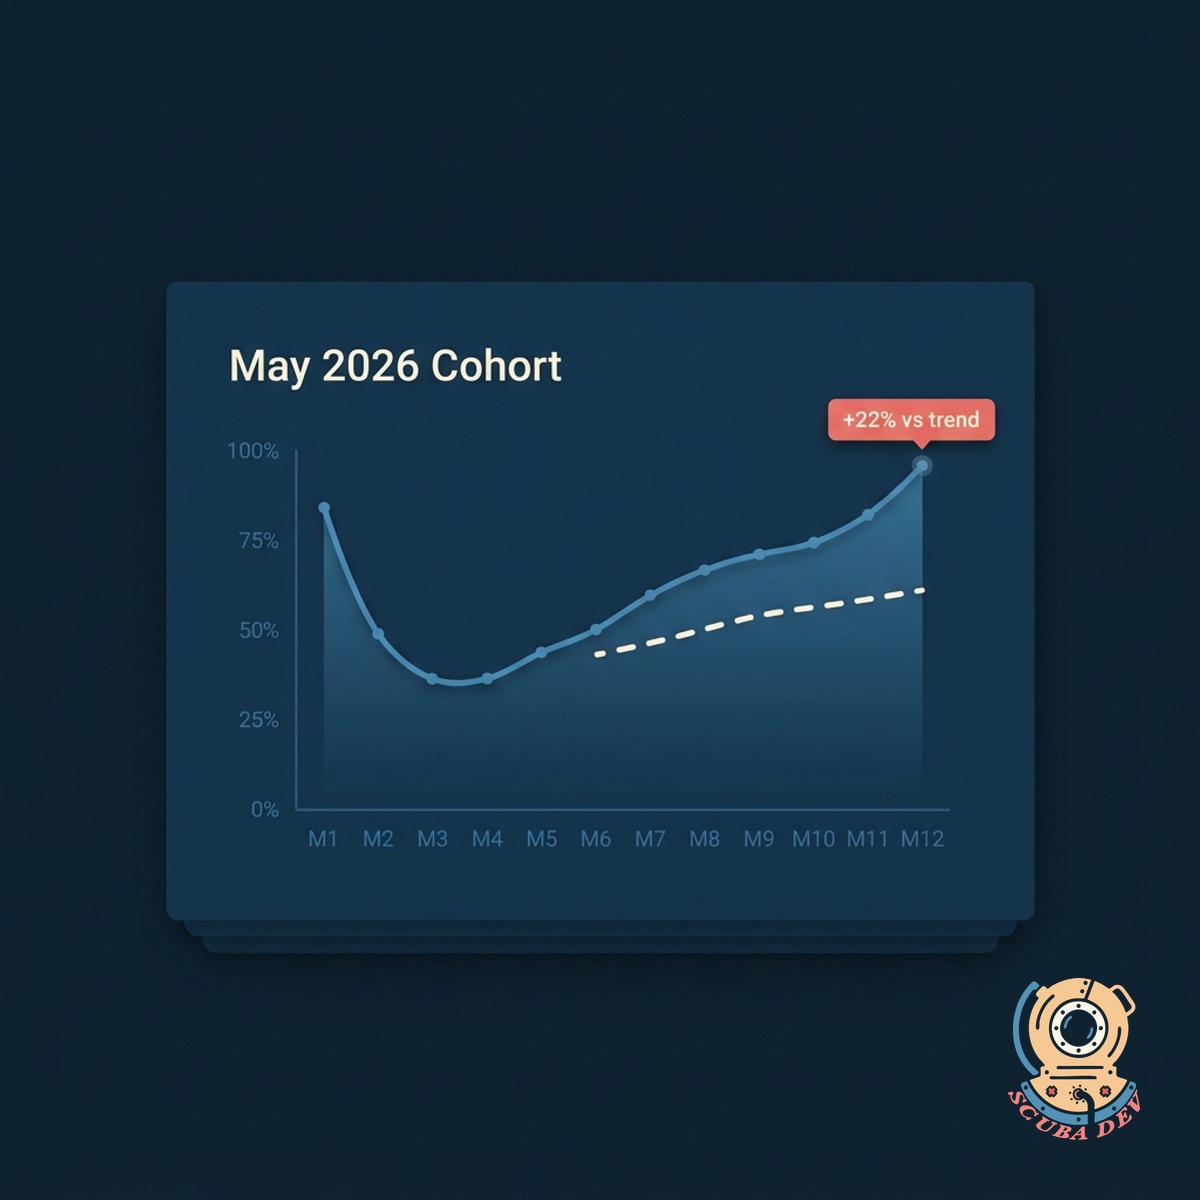
Breakout Cohorts Flagged
Highlights the months that broke the pattern. A cohort with unusual retention, up or down, surfaces with a coral chip and the likely cause.
- Compares each cohort against the trailing six-month average
- Coral alert for outliers, up or down
- Suggested cause pulled from your product release calendar, pricing changes, or campaign launches
- One-click drilldown into the cohort's user list
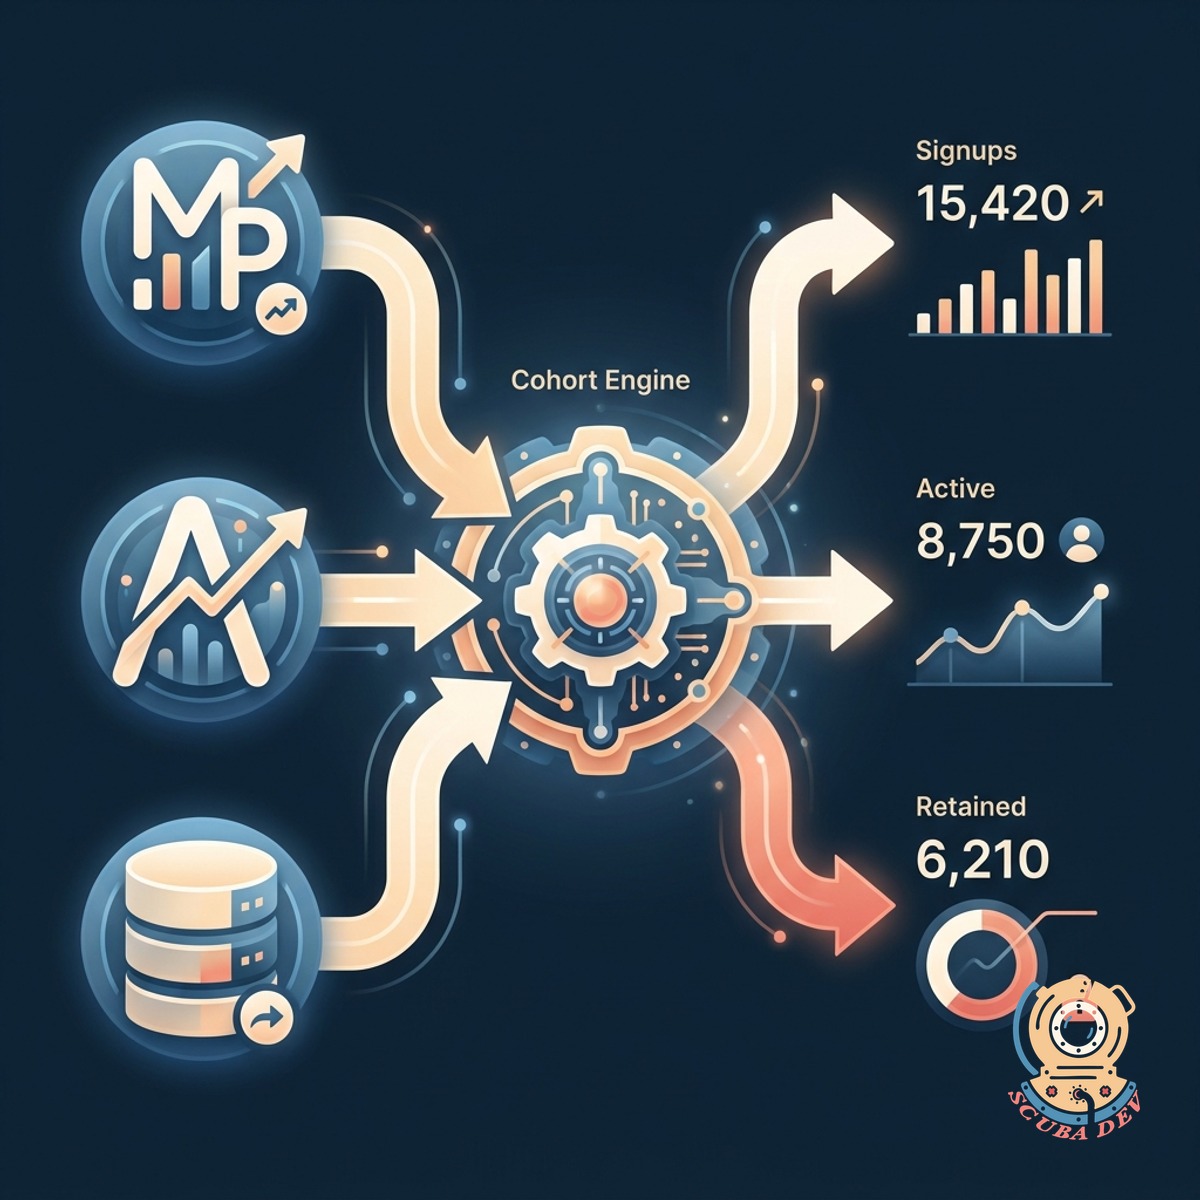
Built On Your Data
Pulls cohorts from your existing user events. No new tracking required. Refreshes overnight, with manual refresh on demand.
- Reads from Mixpanel, Amplitude, PostHog, Heap, Segment, or a warehouse
- Defines retention per your chosen event (login, active action, paid conversion)
- Overnight refresh with manual trigger anytime
- Export to CSV or push to your BI tool
Questions
Things people ask
What data does the board need?
A record of who signed up and when, plus the event that defines retention for you. Most clients use Mixpanel, Amplitude, Heap, PostHog, Segment, or events stored in a warehouse like Snowflake or BigQuery.
How do we define retention?
You choose. A login, a core product action, a paid conversion, or a combination. We help pick the event that correlates with long-term value during setup, and you can change it anytime.
Can we segment cohorts?
Yes. Split cohorts by plan tier, acquisition channel, persona, region, or any attribute in your user table. Compare two segments side by side with one click.
How does the breakout detection work?
Each cohort is compared against the trailing six-month average. If retention moves more than a configurable threshold, it flags. You set the threshold based on your product volatility.
Can we link cohort changes to what caused them?
Yes. You can feed in your release calendar, pricing changes, campaign launches, and support incidents. The board annotates the cohort grid with what happened when, so causes stop being a guess.
How often does it refresh?
Overnight by default. You can also trigger a manual refresh from the dashboard at any time. Incremental updates mean the refresh is fast even with millions of users.
Does this replace our BI tool?
No. It is a focused retention view built for product and growth teams. Exports and API access push the cohort data into your BI tool if you want a single source of truth elsewhere.