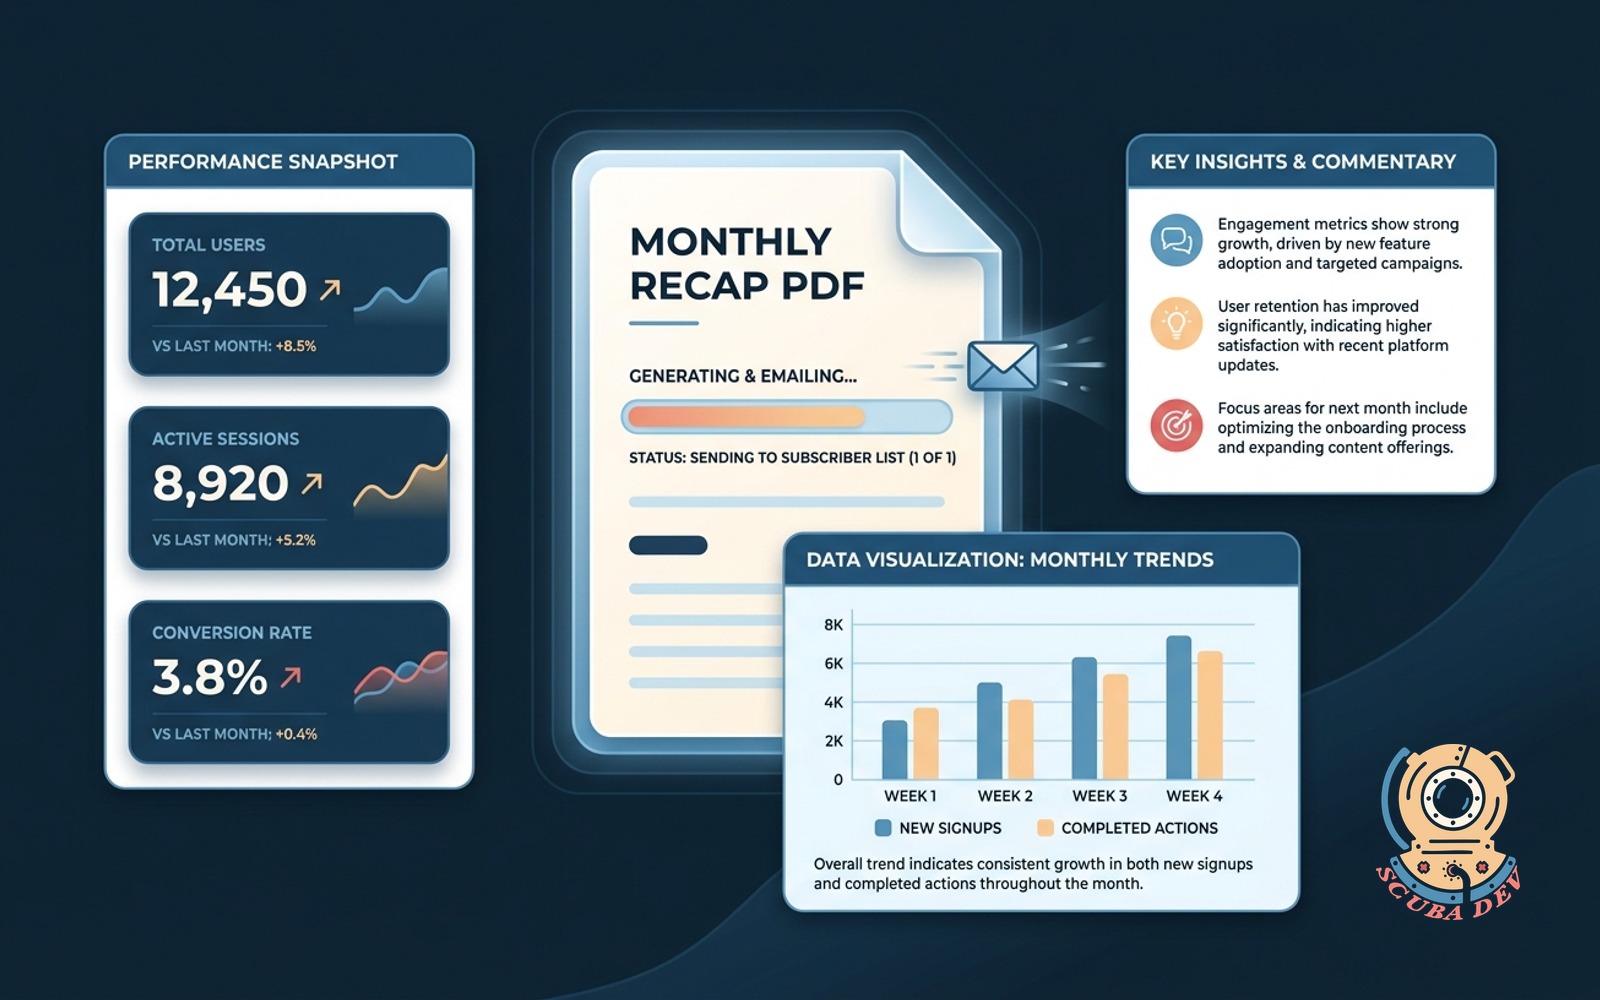
Monthly recap PDF
Numbers, commentary and one chart, rendered as a branded PDF on the first of the month, emailed to the list.
Possibilities
Where this could go
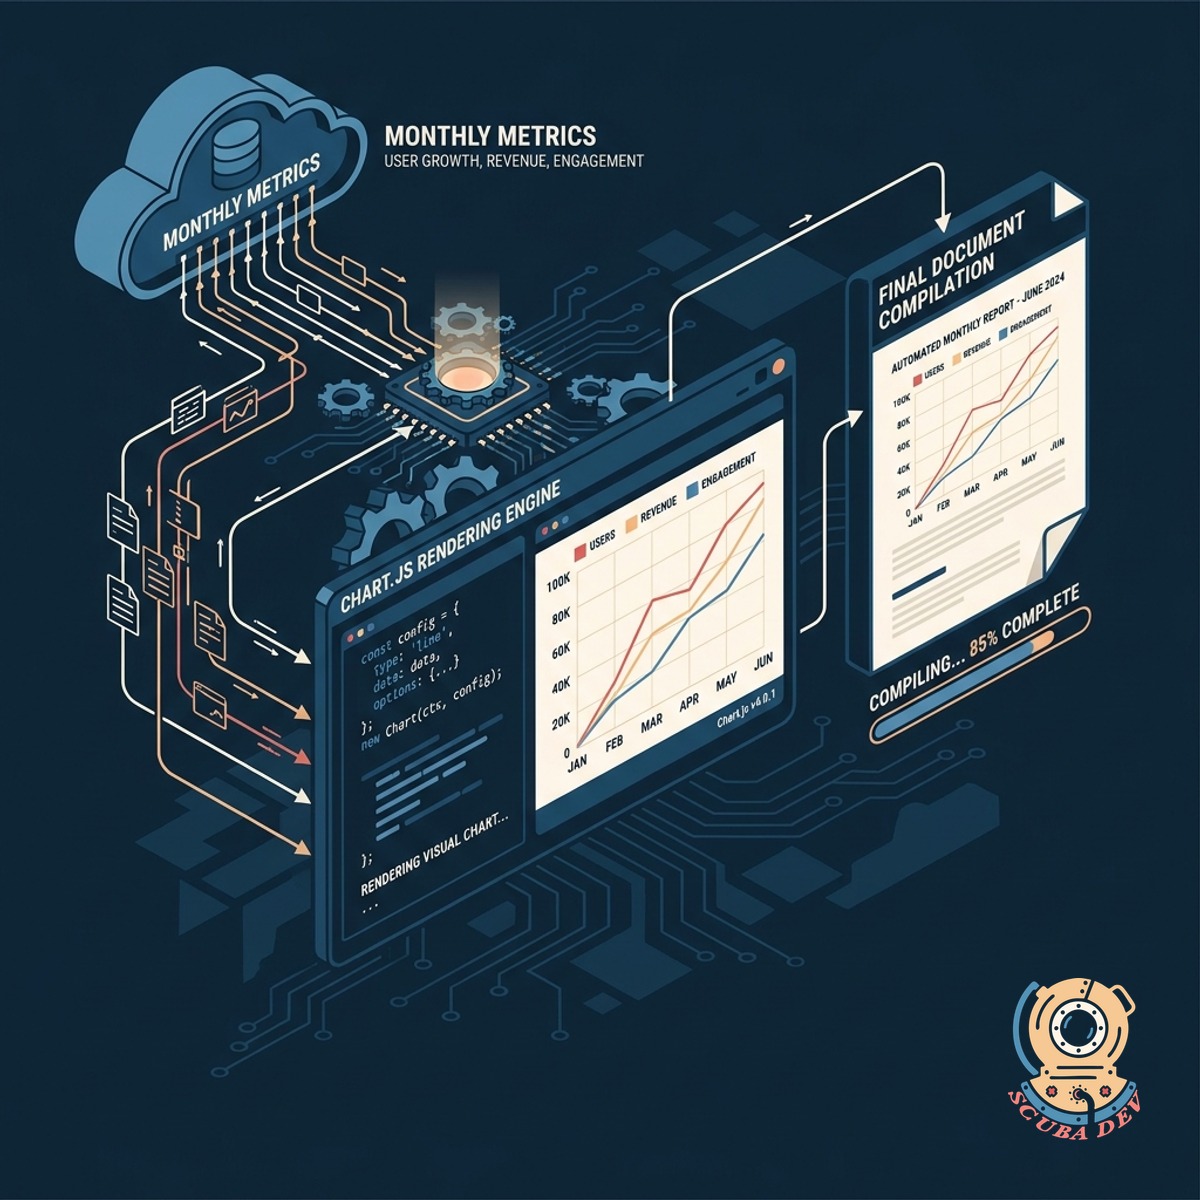
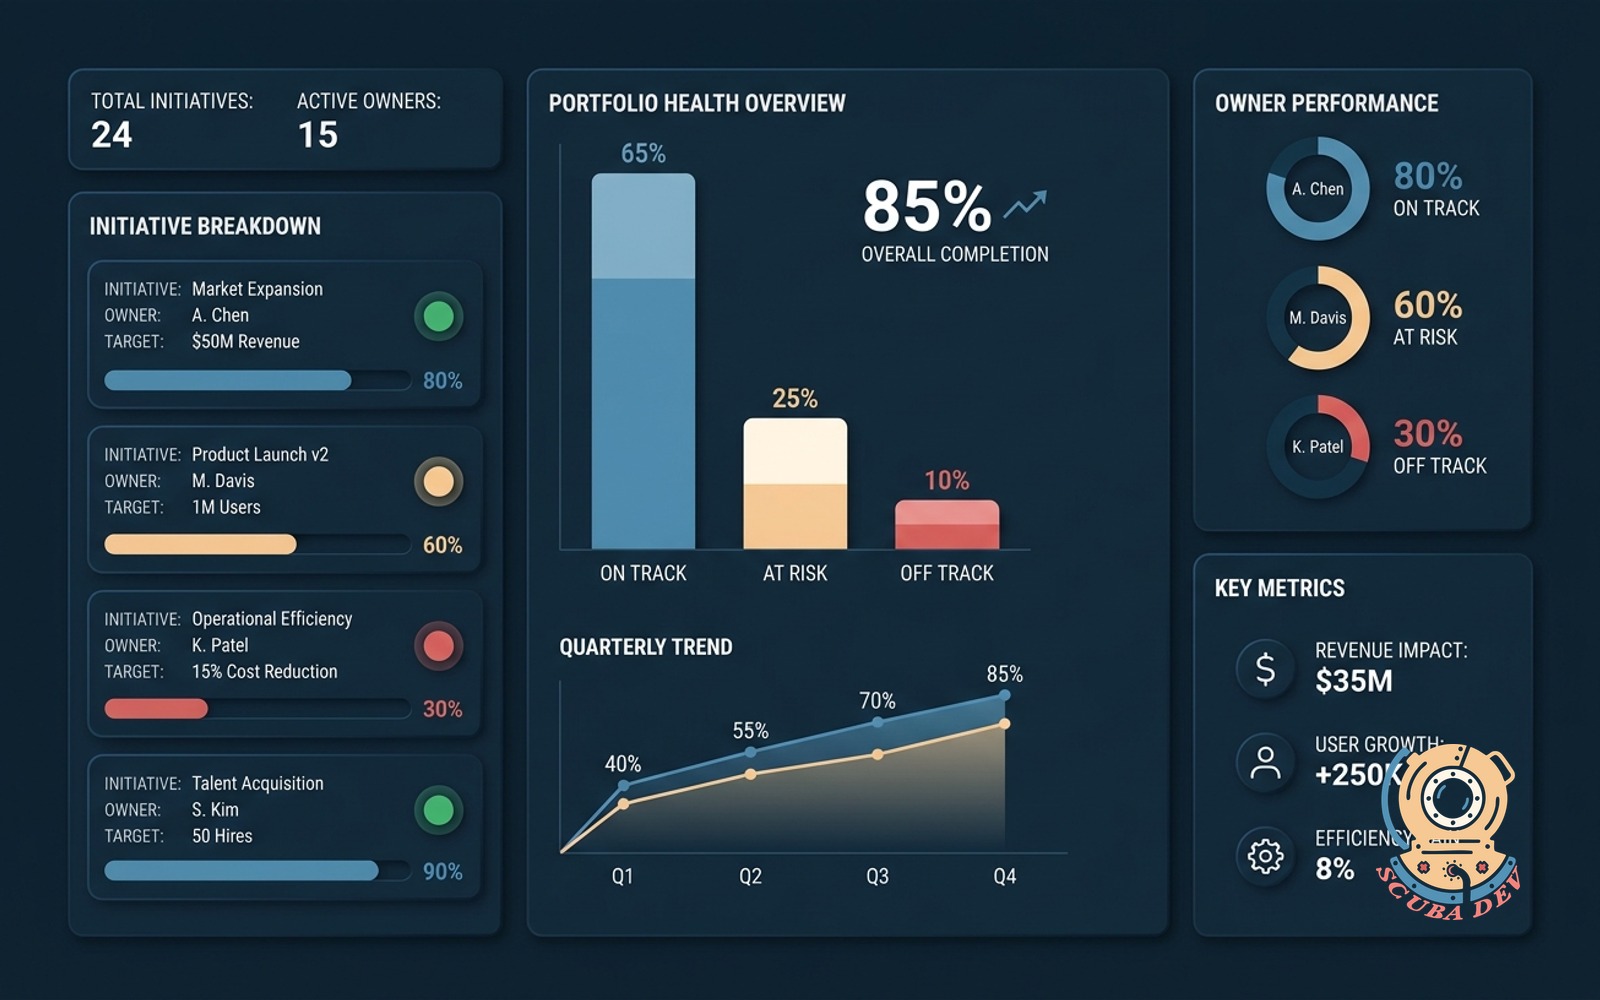
Automated Data Generation Process
The system pulls your monthly metrics and renders a clean visual chart using Chart.js before compiling the final document.
- Fetches data from your database
- Generates a custom visual chart
- Formats key performance numbers
- Prepares text for commentary
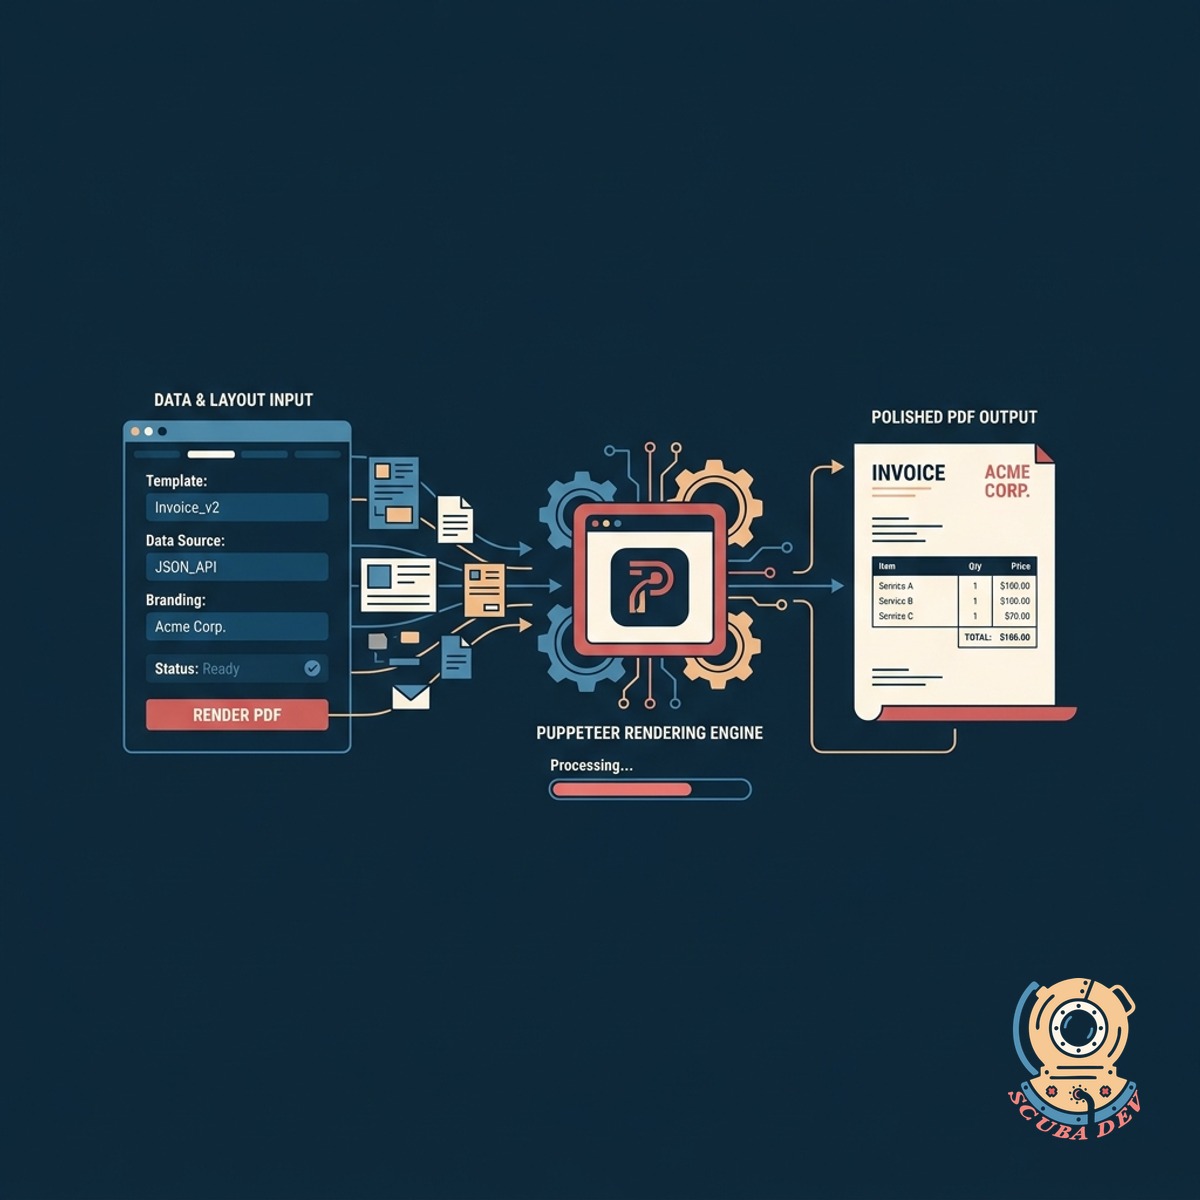
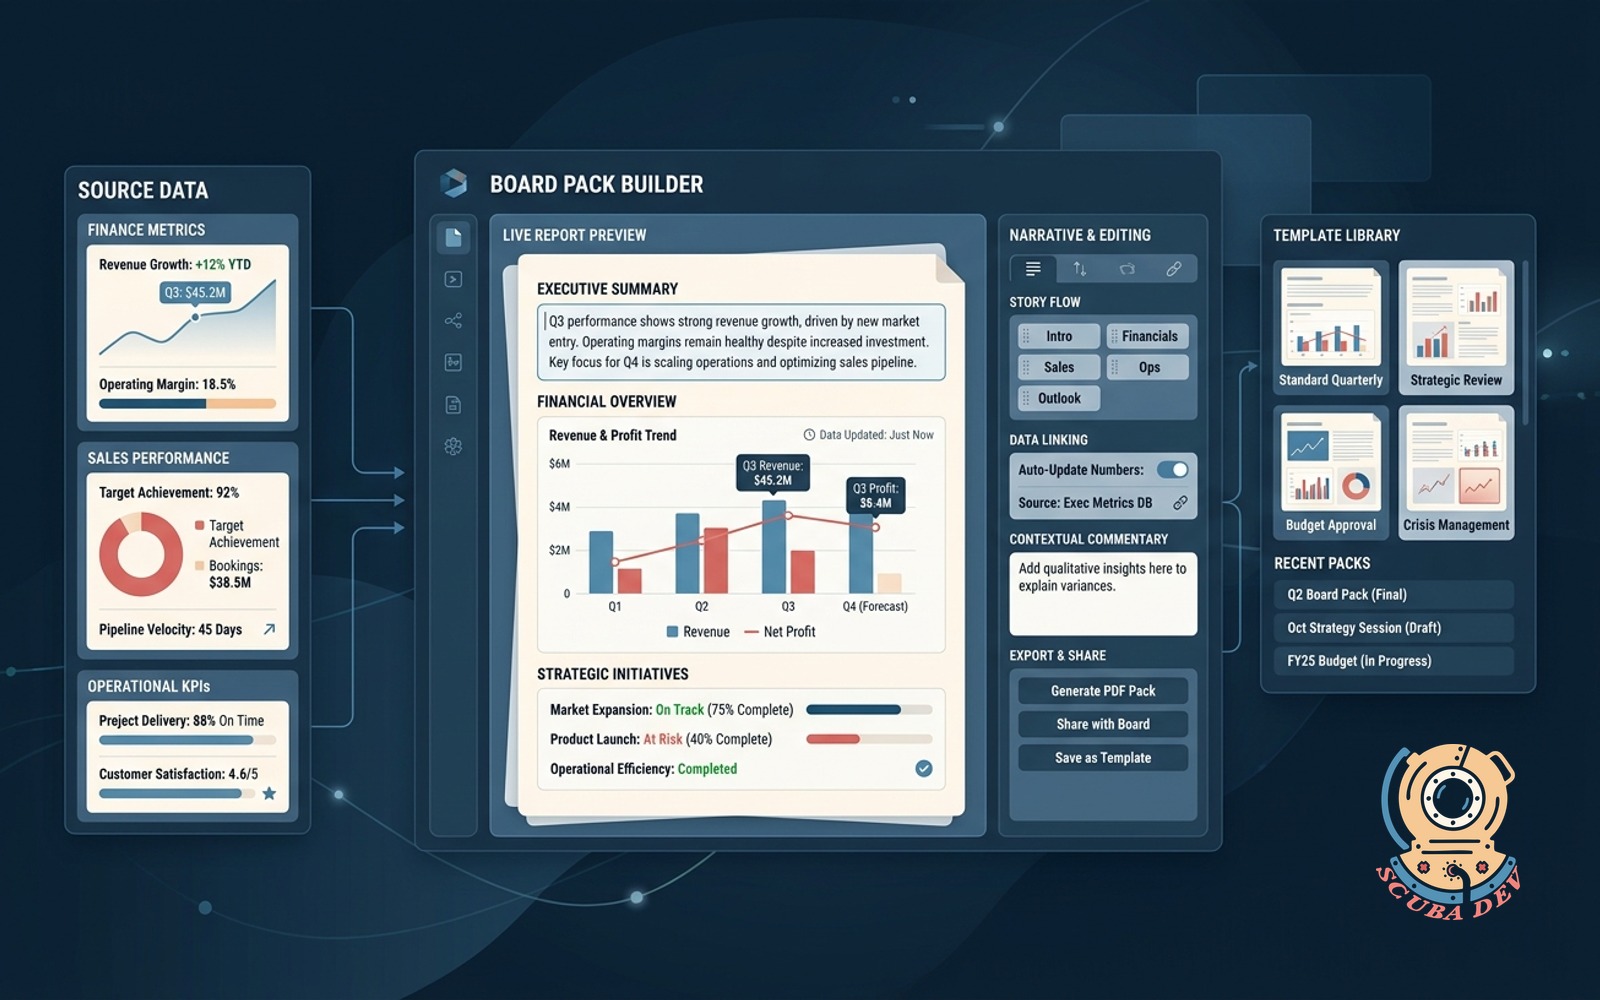
Branded PDF Document Rendering
A background process uses tools like Puppeteer to convert your data and layout into a polished PDF file.
- Applies your brand colors and logo
- Embeds the generated chart
- Formats the commentary text
- Outputs a standard PDF file
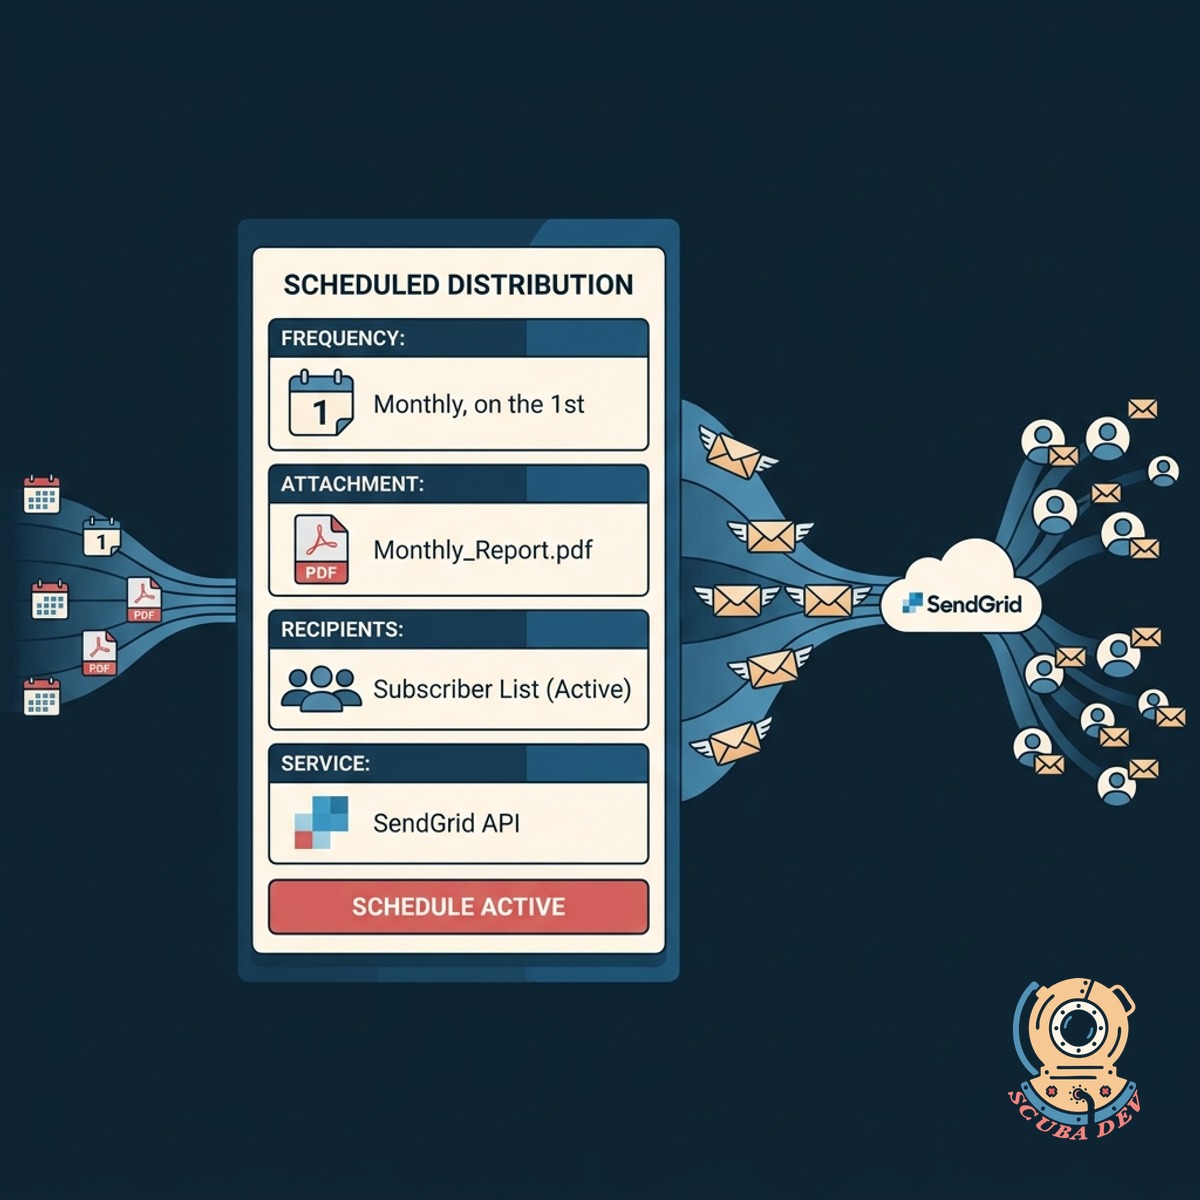
Scheduled Email List Distribution
On the first of every month, the system attaches the PDF and sends it to your subscriber list via SendGrid.
- Triggers on the first of the month
- Connects to your email provider
- Attaches the generated PDF
- Delivers to your defined mailing list
Questions
Things people ask
How does the system generate the PDF?
We use headless browser technology like Puppeteer to render an HTML template into a high quality PDF document. This ensures your branding and layout look exactly as intended.
Can I customize the commentary each month?
Yes. You can input your commentary into a secure dashboard before the end of the month. The system will pull that text and include it in the final PDF.
What kind of chart is included in the report?
We typically use Chart.js to render a single, clear visual. This can be a bar chart, line graph, or pie chart depending on the specific metrics you want to highlight.
How does the automated emailing work?
A scheduled task runs on the first of the month. It generates the PDF, connects to an email API like SendGrid or Postmark, and sends the message to your subscriber list.
Where does the numerical data come from?
The tool connects directly to your database or third party APIs to pull the exact numbers required for your monthly recap.
Can the PDF match my company branding?
Absolutely. The underlying template uses standard web technologies like CSS, allowing us to apply your exact fonts, colors, and logos to the final document.
What happens if the data pull fails?
The system includes error handling. If a data source is unavailable, it will alert you and pause the email send so you can resolve the issue before the report goes out.