End of quarter pipeline report
Snapshots pipeline health, win rates, stalled deals and forecast accuracy against plan for review.
Possibilities
Where this could go
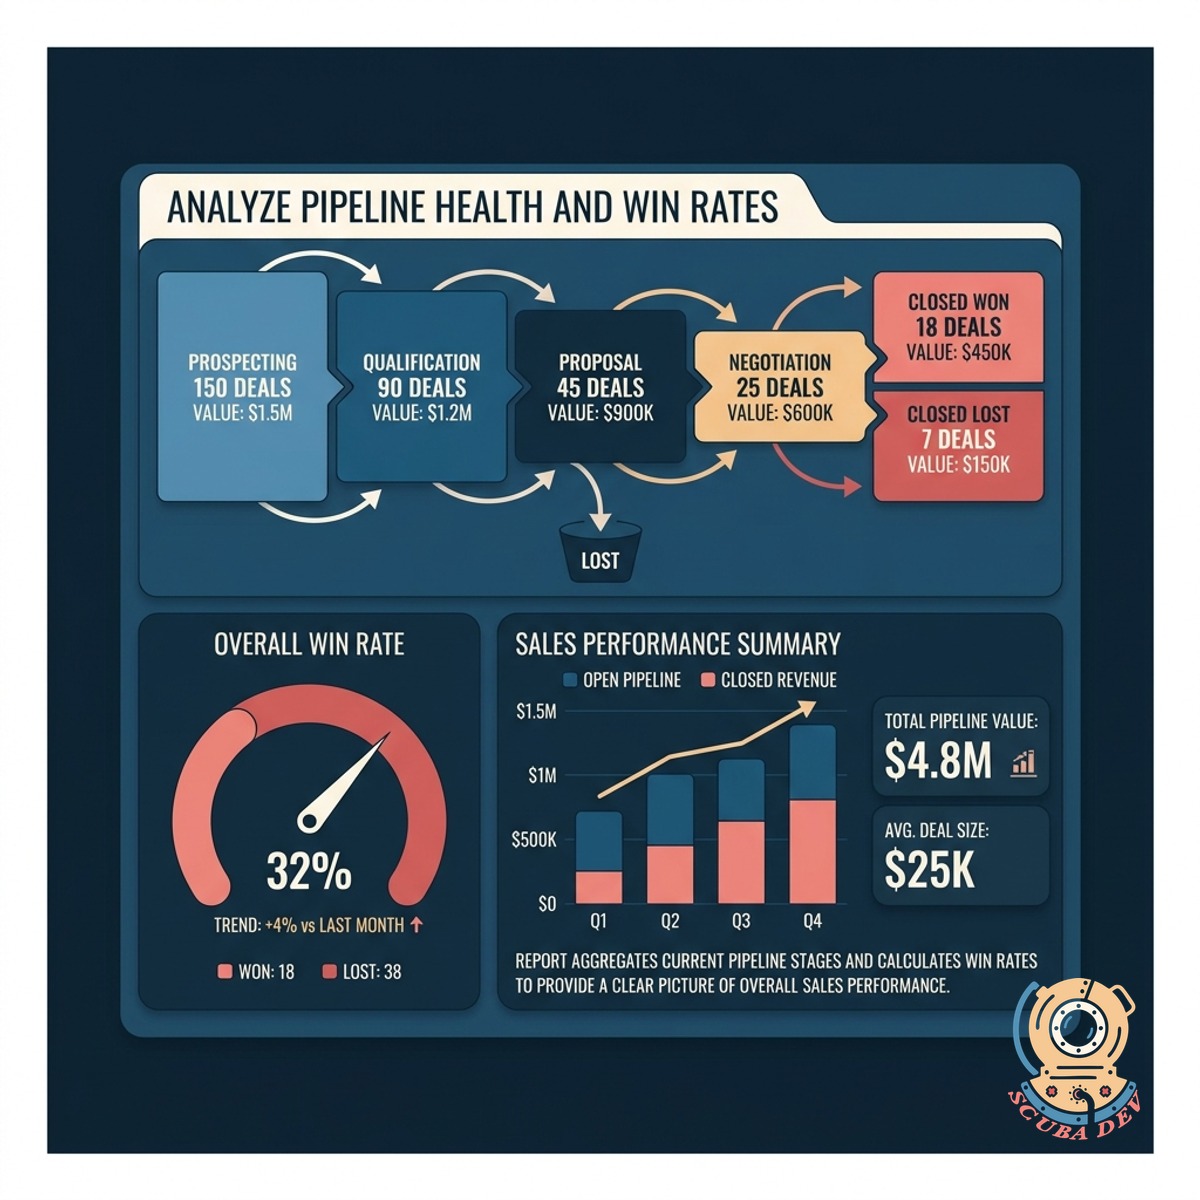
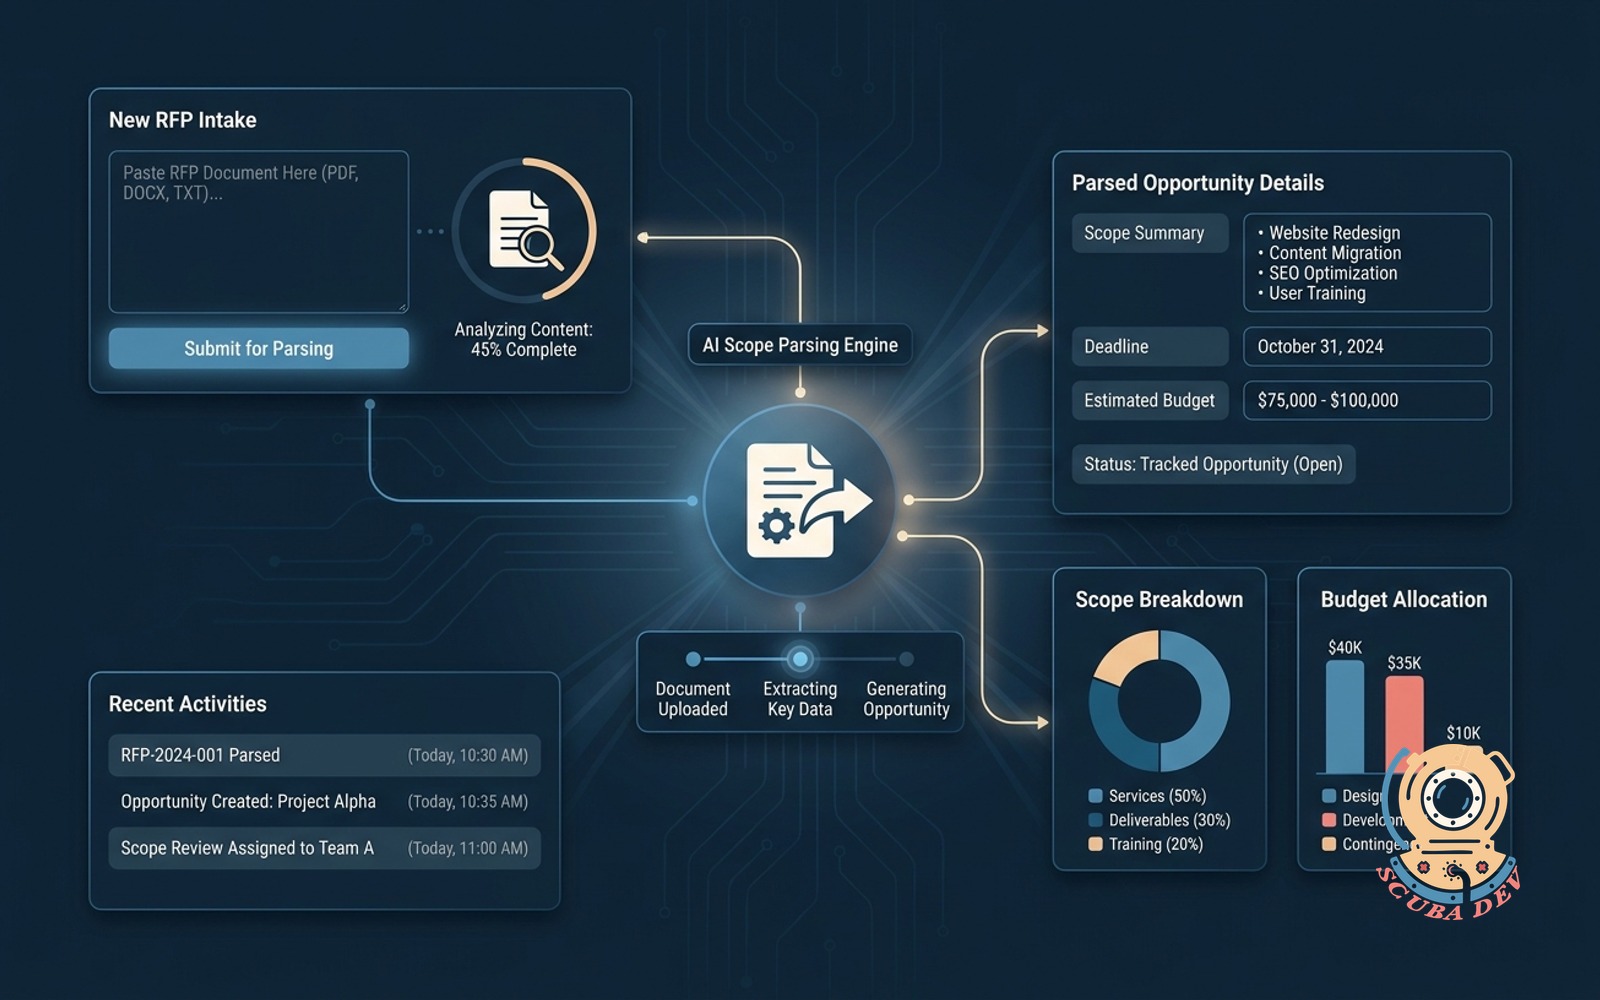
Analyze Pipeline Health and Win Rates
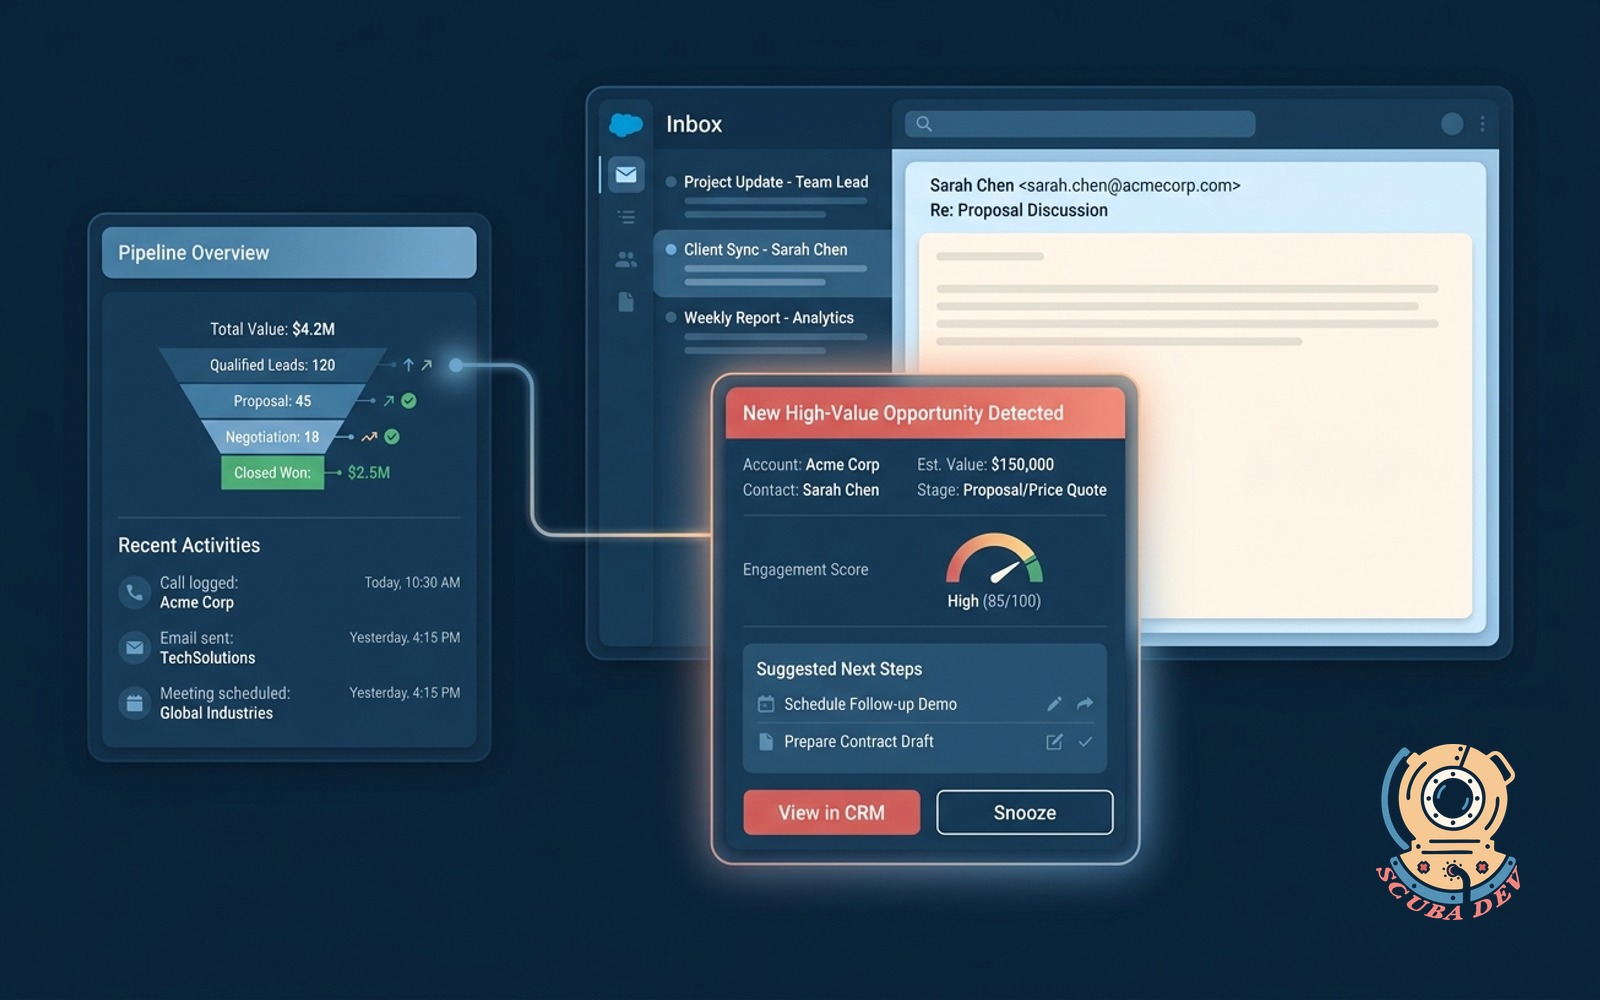
The report aggregates current pipeline stages and calculates win rates to provide a clear picture of overall sales performance.
- Track stage progression
- Calculate historical win rates
- Identify bottleneck stages
- Export data for review
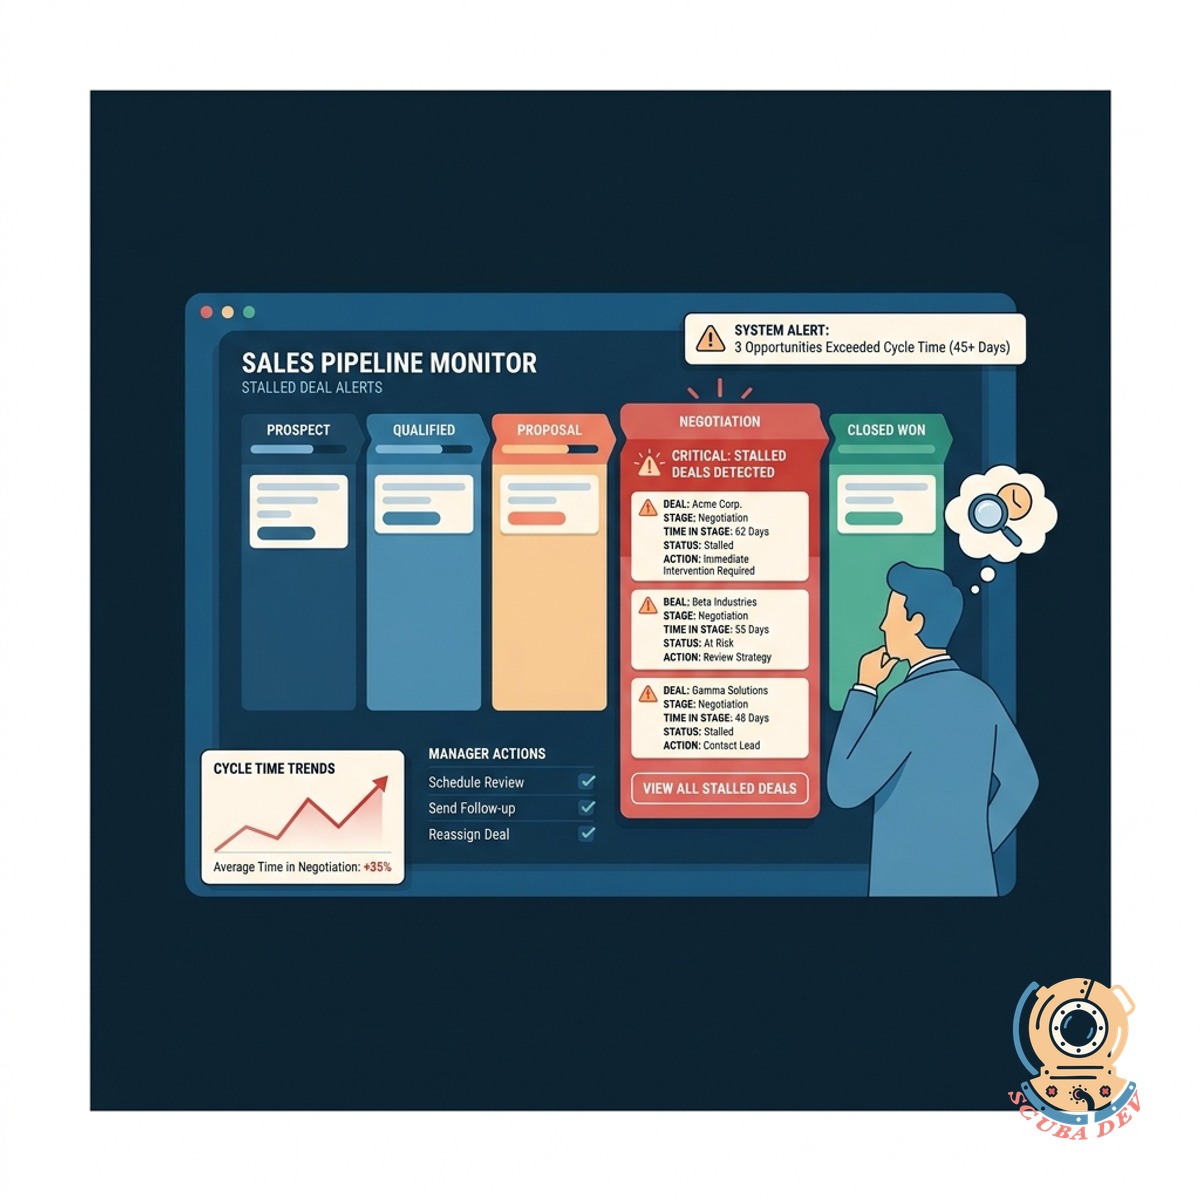
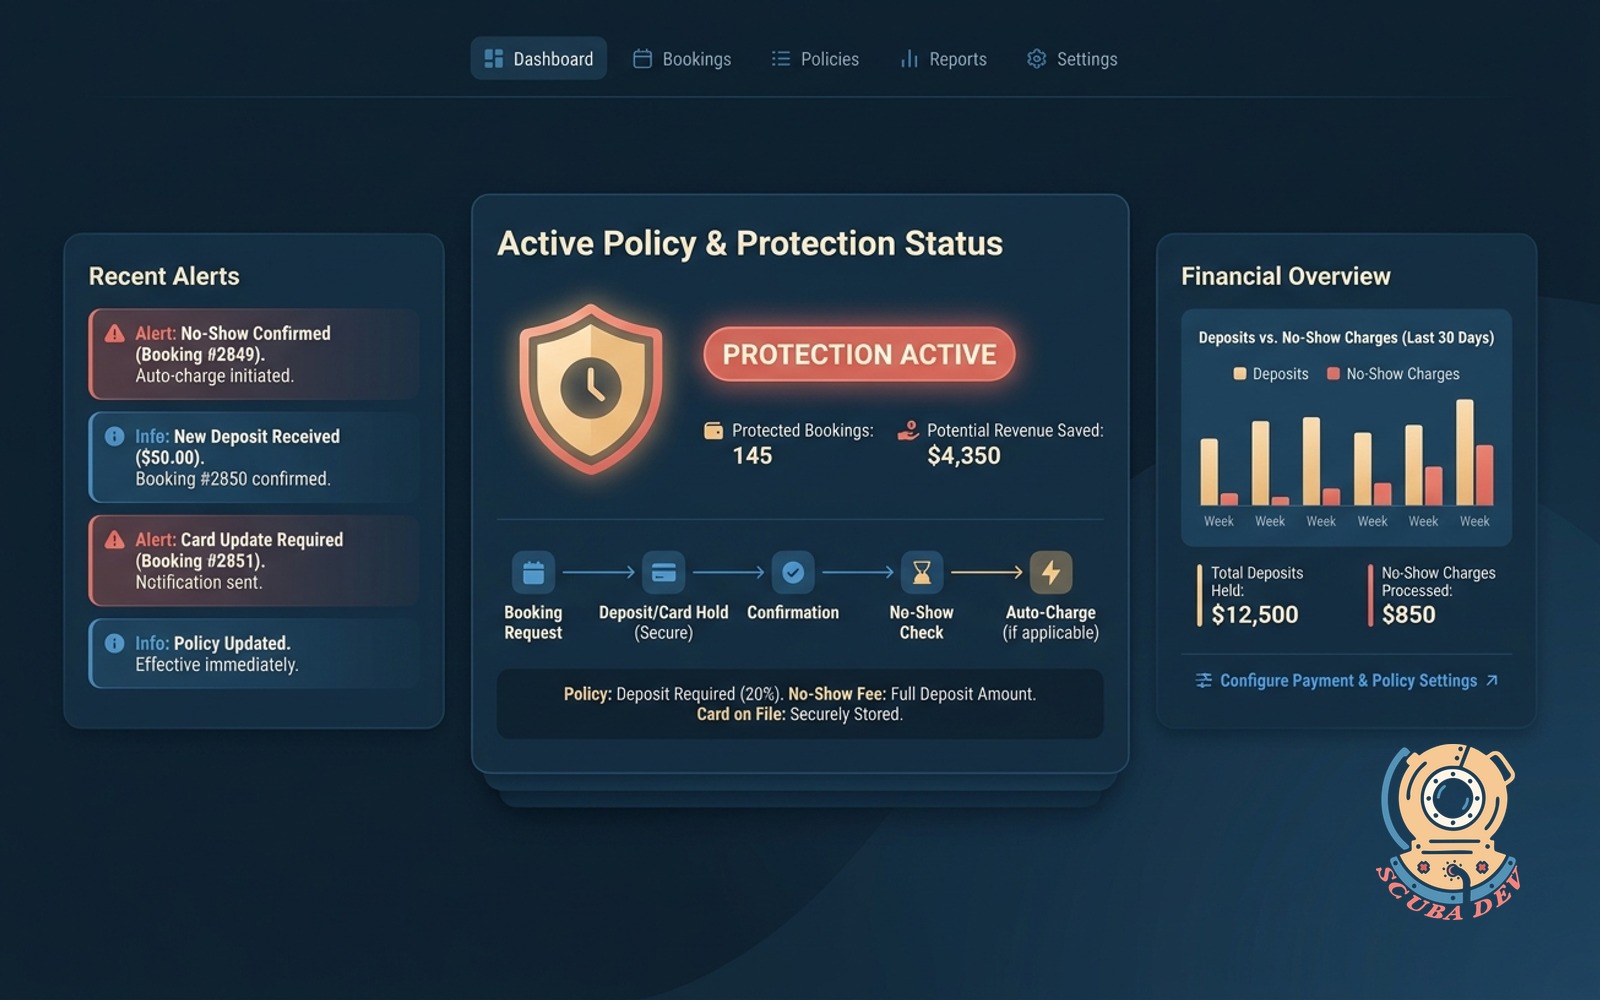
Identify Stalled Deals for Immediate Action
The system flags opportunities that have remained in the same stage beyond standard cycle times so sales managers can intervene.
- Set custom age thresholds
- Flag inactive opportunities
- Notify account executives
- Reassign neglected accounts
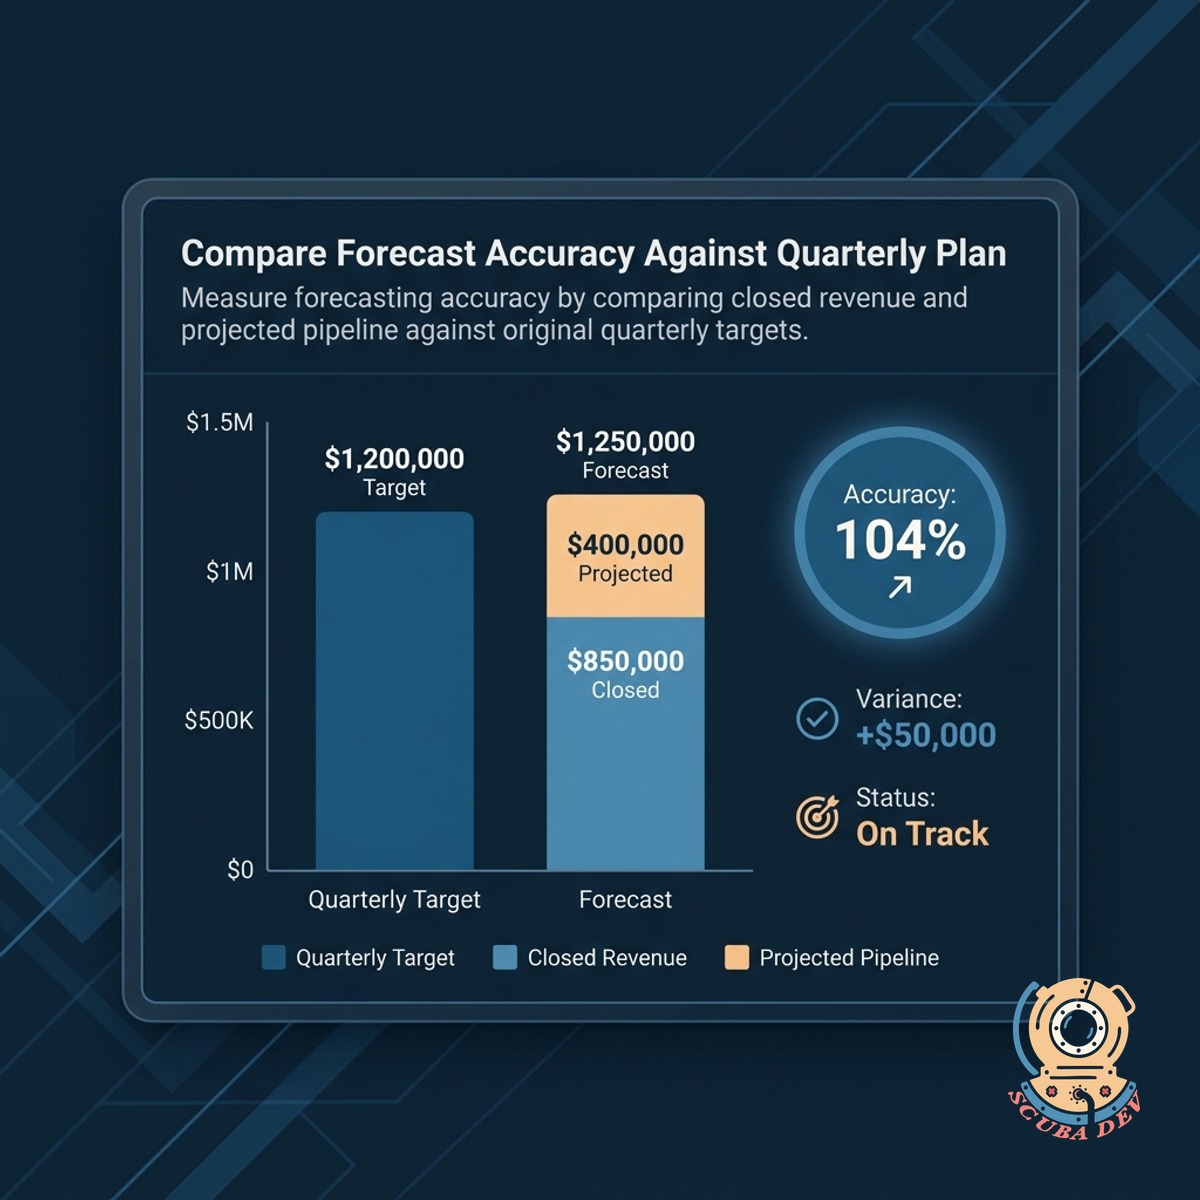
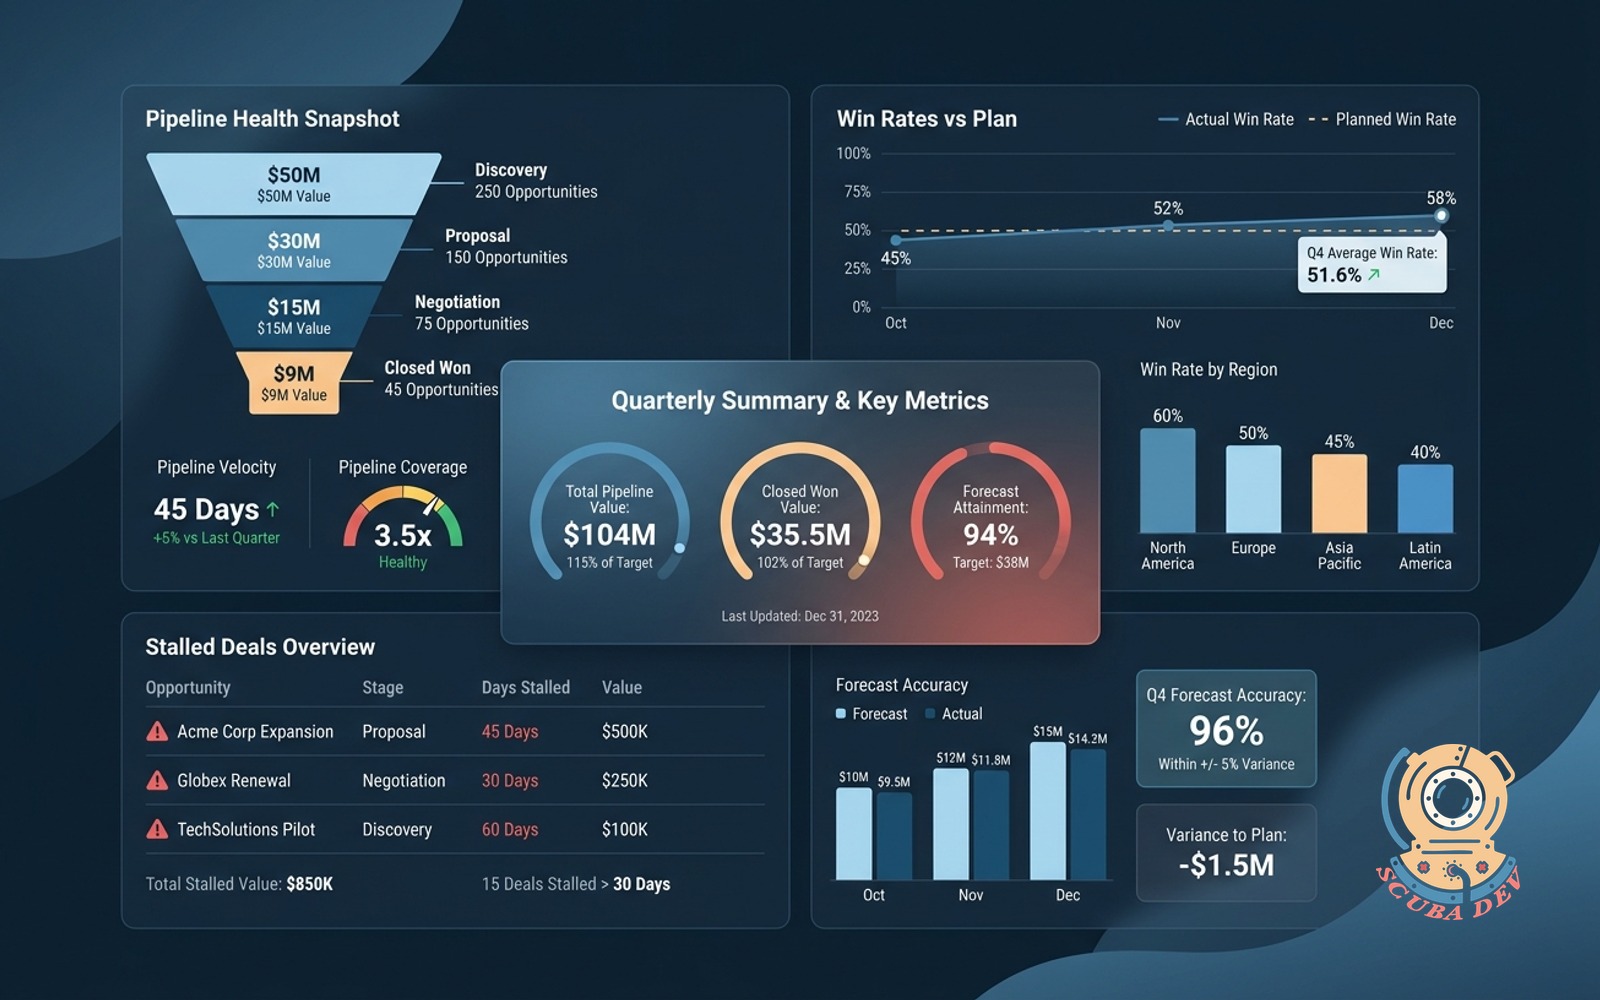
Compare Forecast Accuracy Against Quarterly Plan
The tool compares closed revenue and projected pipeline against your original quarterly targets to measure forecasting accuracy.
- Measure projected versus actual
- Track quota attainment
- Adjust future baseline targets
- Review historical accuracy
Questions
Things people ask
Which CRM platforms can this report connect to?
The report integrates directly with major CRM platforms like Salesforce, HubSpot, and Pipedrive to pull real time opportunity data.
How does the system define a stalled deal?
You configure the criteria for stalled deals based on your typical sales cycle. The tool flags any opportunity that sits in a single stage longer than your specified threshold.
Can we customize the pipeline stages in the report?
Yes. The report maps directly to your custom CRM stages so the metrics reflect your specific sales process and terminology.
How is forecast accuracy calculated?
The tool compares your initial quarterly revenue targets and early pipeline projections against the actual closed won revenue at the end of the quarter.
Does the report show individual sales rep performance?
The dashboard includes filters to view pipeline health, win rates, and stalled deals by individual account executives or by entire sales teams.
Can we export the end of quarter report?
You can export the full report as a PDF or CSV file to share with stakeholders during quarterly business reviews.
How often does the pipeline data refresh?
The report syncs with your CRM on a scheduled basis. You can set it to refresh daily or trigger a manual sync right before your review meeting.