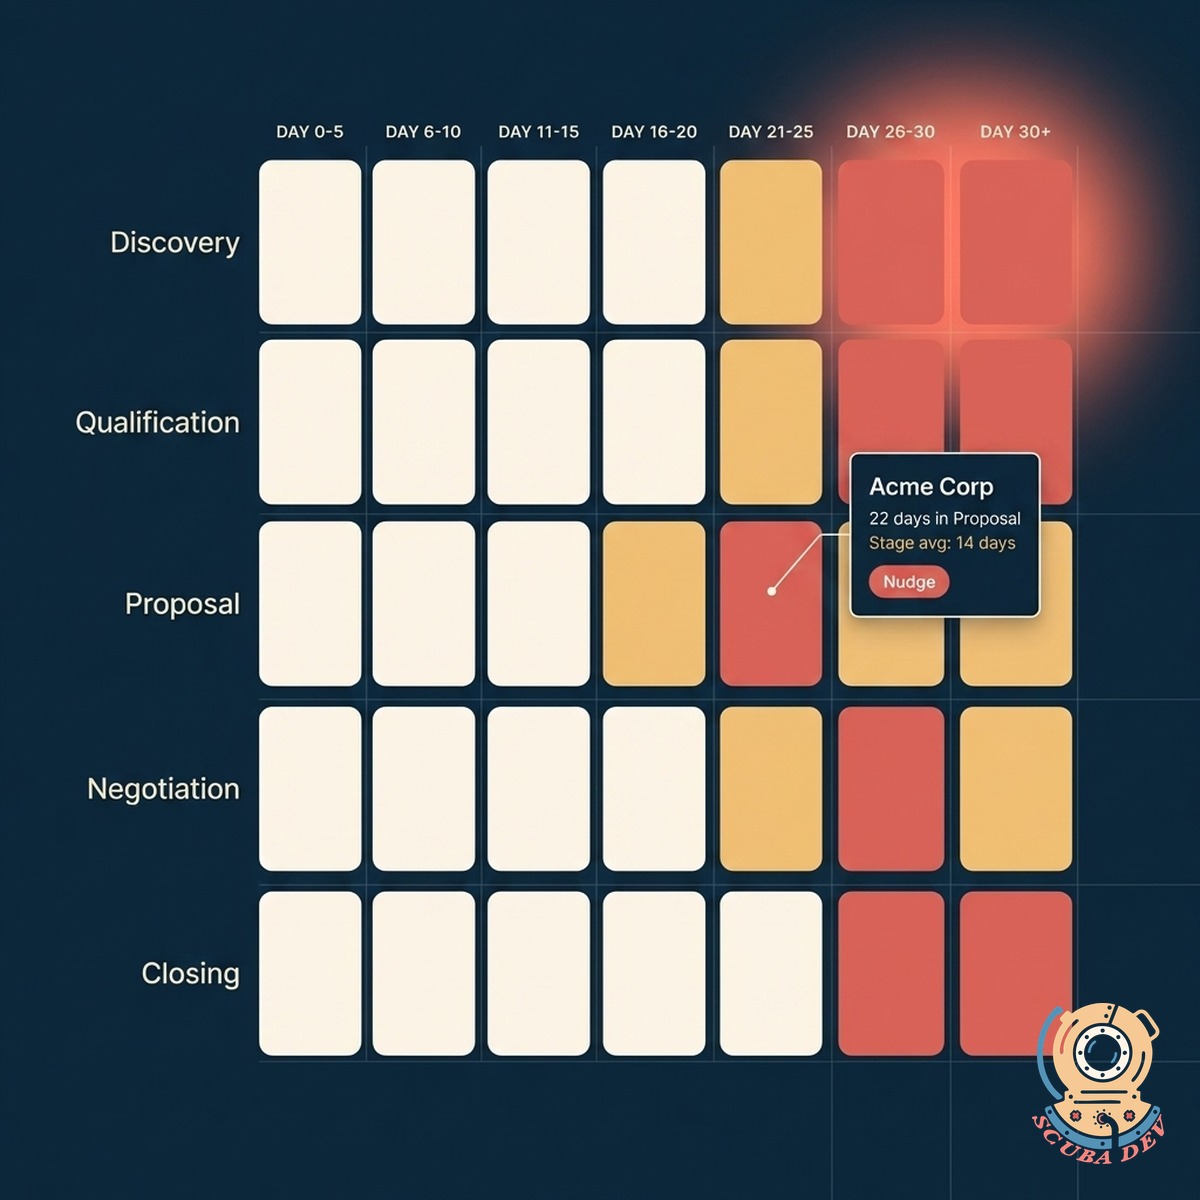
Deal stage aging heatmap
Colors every open deal by days in stage. Hot list of deals stuck past the average for that stage.
Possibilities
Where this could go
Every Deal, Color-Coded
Open deals shaded by how many days they have been in their current stage. Instant read on where the pipeline is stuck.
- Coral cells flag deals past the stage average
- Gold cells warn when a deal is trending toward stuck
- Cream cells confirm deals moving at expected pace
- Hover any cell to see the rep, the amount, and the last activity

Hot List, Not A Data Dump
Surfaces the deals stuck past the stage average with the specific reason they are flagged. One click and you can nudge the owner.
- Top ten stuck deals ranked by amount at risk
- Reason shown per deal (no contact in 14 days, missed next step, dormant champion)
- One-click nudge to the rep with context attached
- Escalate to the manager when the rep does not respond
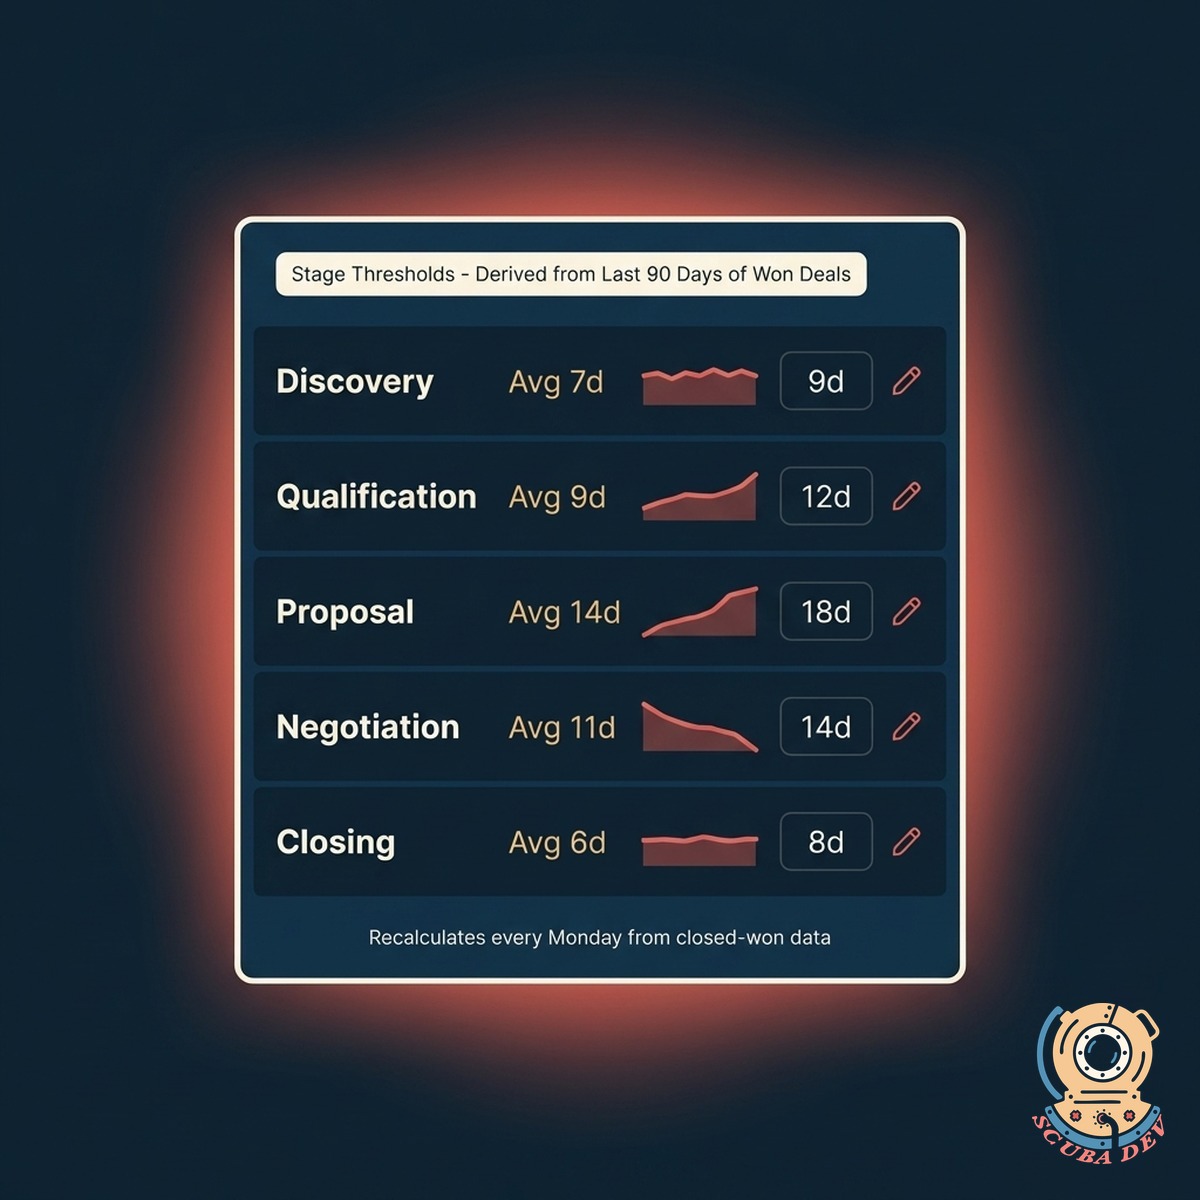
Tuned To Your Playbook
The stage averages come from your data, not a generic benchmark. Every team has a different cadence, so the heatmap reads yours.
- Uses your last 90 days of won deals to set stage averages
- Adjust thresholds per stage, per segment, or per rep
- Re-trains automatically as your playbook evolves
- Exec view shows aging by segment, not just by rep
Questions
Things people ask
Which CRMs does this connect to?
Salesforce, HubSpot, Pipedrive, Zoho, GoHighLevel, Close, Copper, and most CRMs with a REST API. We also work with custom builds as long as we can query open deals and their stage timestamps.
How are the stage averages calculated?
We use your last 90 days of closed-won deals. Each stage gets its own average, and we recalc weekly. You can override any threshold manually if you know the data has an outlier quarter.
Can different reps have different thresholds?
Yes. Sometimes a senior rep runs a longer cycle on purpose. You can override thresholds per rep, per segment, or per product line. Overrides show up as notes on the heatmap so managers see the context.
What activities count as movement?
Anything logged to the CRM: emails, calls, meetings, proposal sends, contract activity. You can also define custom events (like a demo scheduled through your calendar tool) that should reset the aging clock.
How do nudges work?
One click sends a Slack DM or email to the rep with the deal name, the reason it is flagged, and a suggested next action. If the rep does not respond in your chosen window, the manager gets looped in automatically.
Does this replace our existing pipeline view?
No. It complements it. The heatmap is a different read on the same data, built for managers who want to see stuck deals at a glance. Reps still work out of the CRM.
Can we share this with executives?
Yes. The exec view rolls up by segment, product, or region rather than by individual rep. You can also schedule a weekly snapshot email that captures how pipeline health is trending.