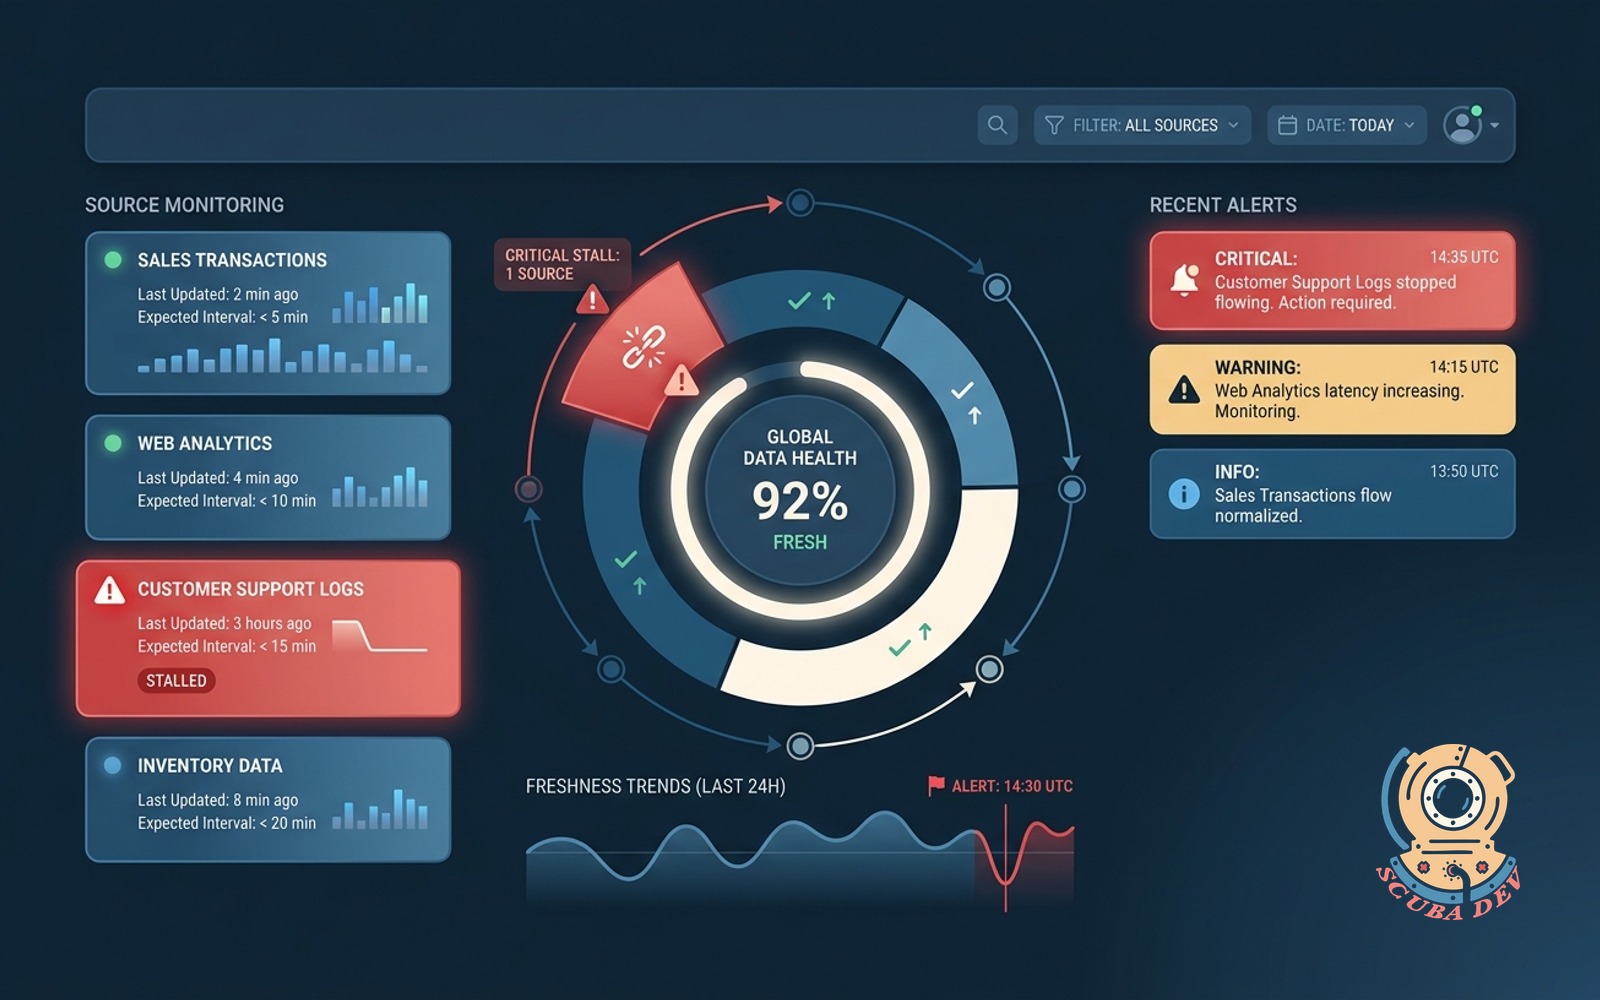
Data freshness dashboard
Every table tracked for last-updated time and expected interval. Red flags any source that stops flowing.
Possibilities
Where this could go
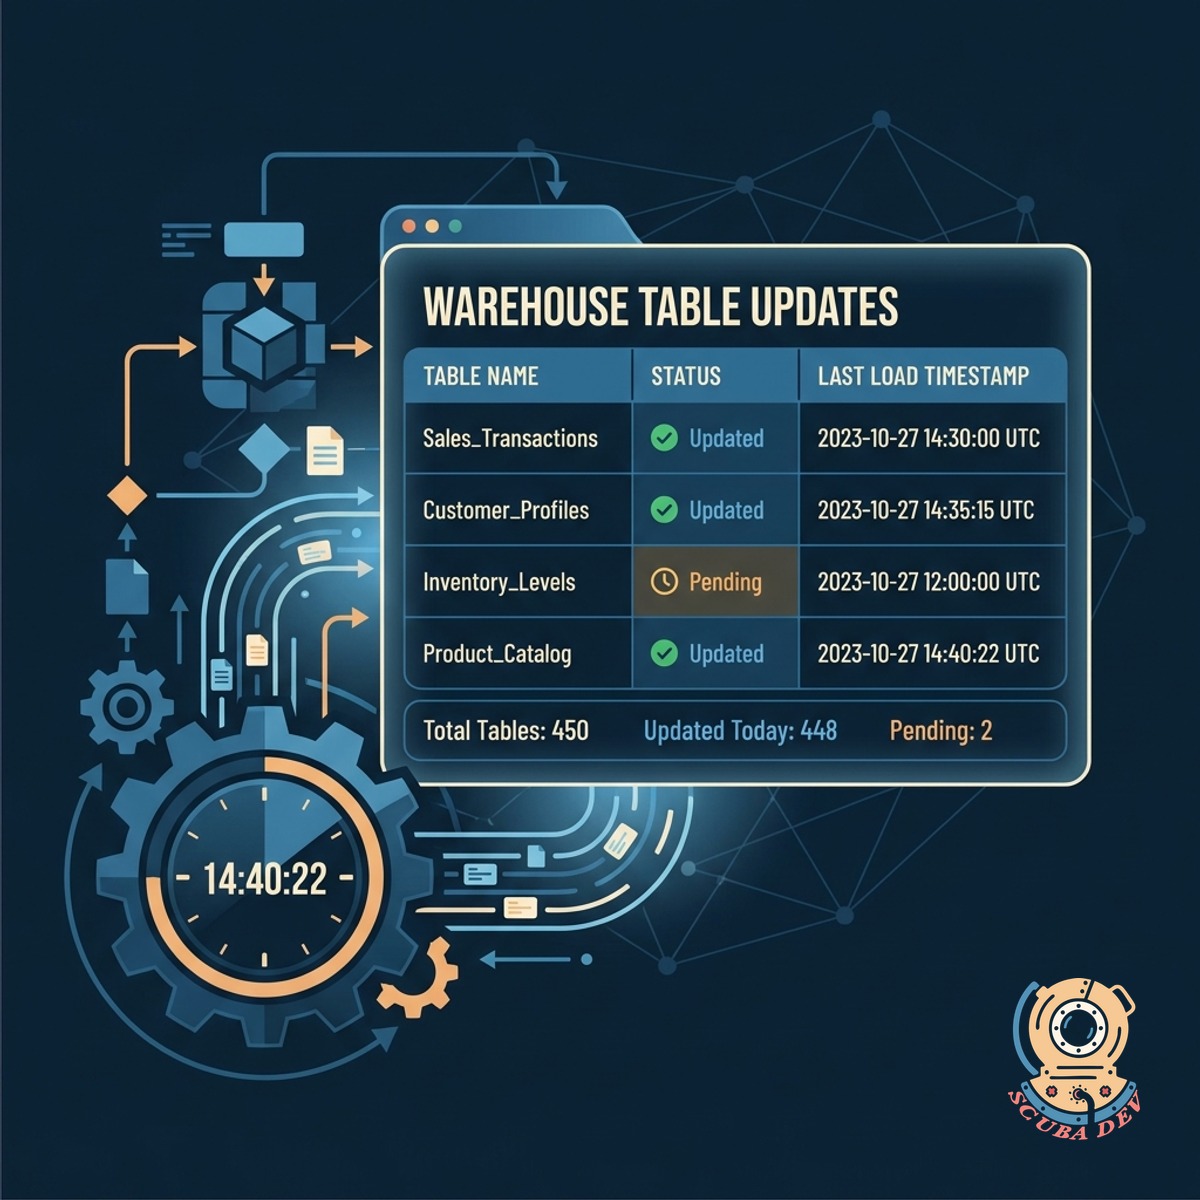
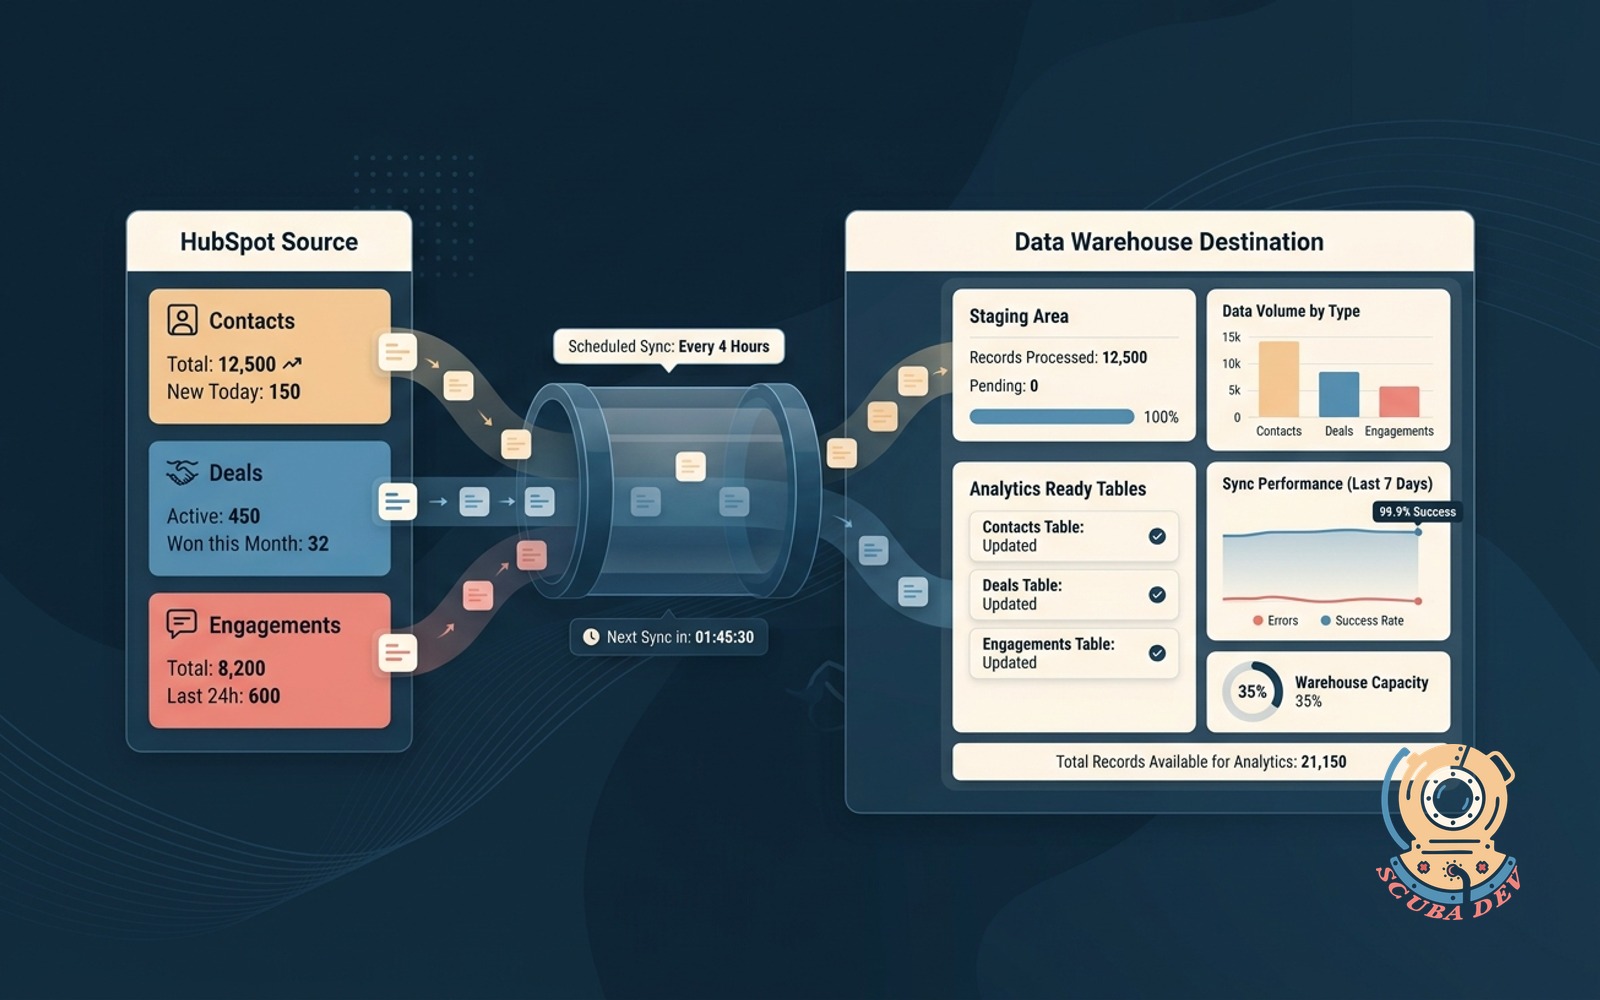
Automated Table Update Tracking
The dashboard logs the exact timestamp of the most recent data load for every table in your warehouse.
- Monitor PostgreSQL and Snowflake tables
- Set expected update intervals per source
- View last synced timestamps at a glance
- Sort by most recently updated
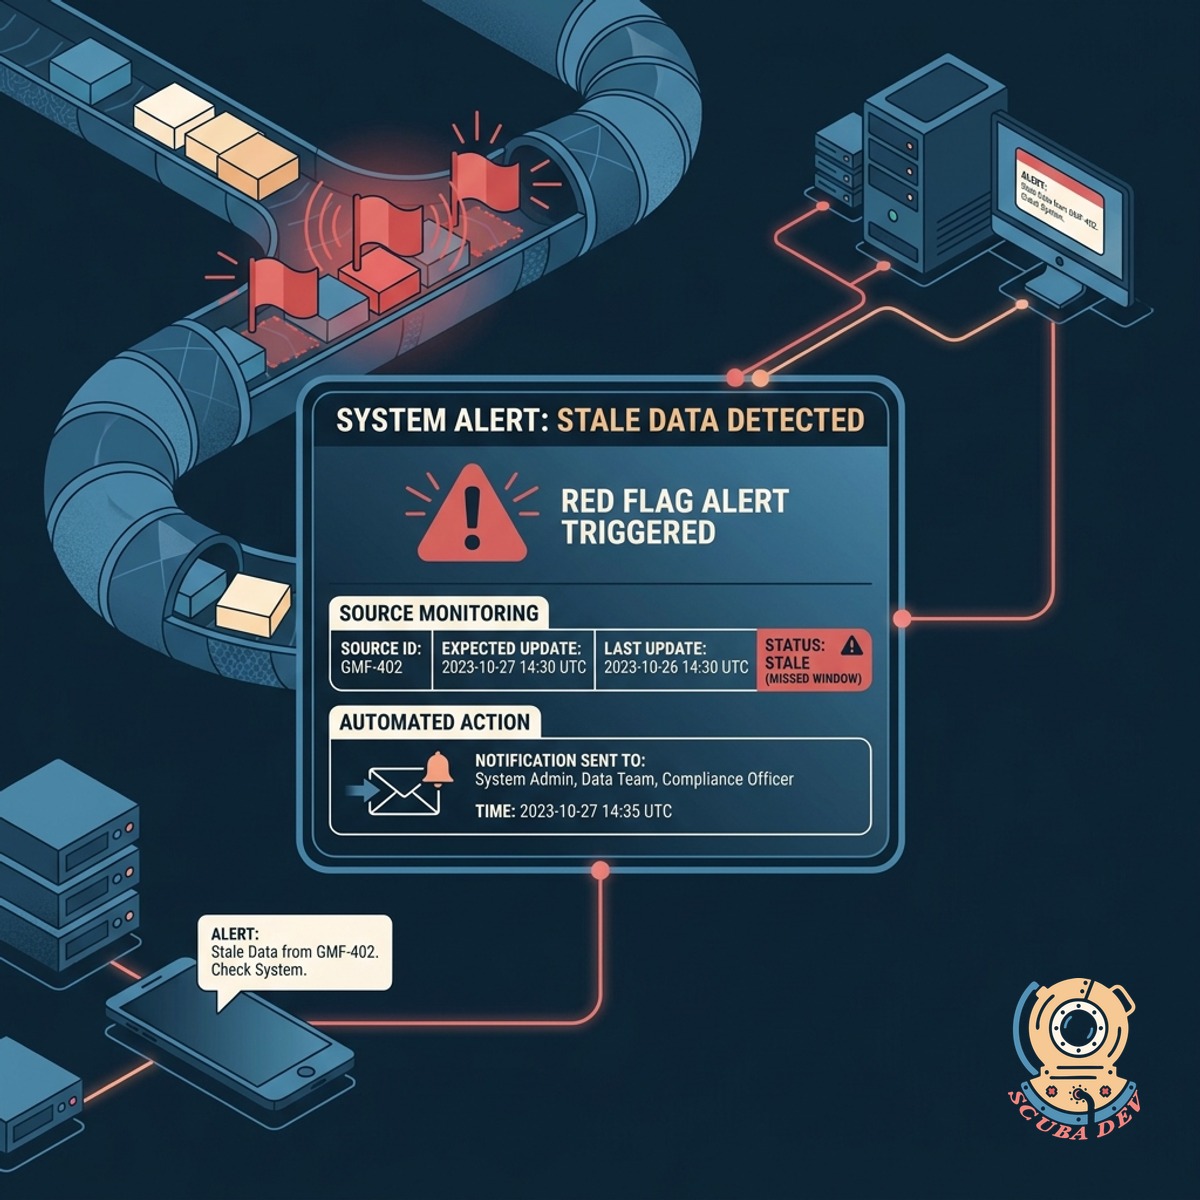
Red Flag Alerts For Stale Data
The system automatically triggers a visual warning and sends a notification when a source misses its expected update window.
- Define custom thresholds for each pipeline
- Receive Slack or email notifications instantly
- Highlight failing syncs in red
- Prevent downstream reporting errors
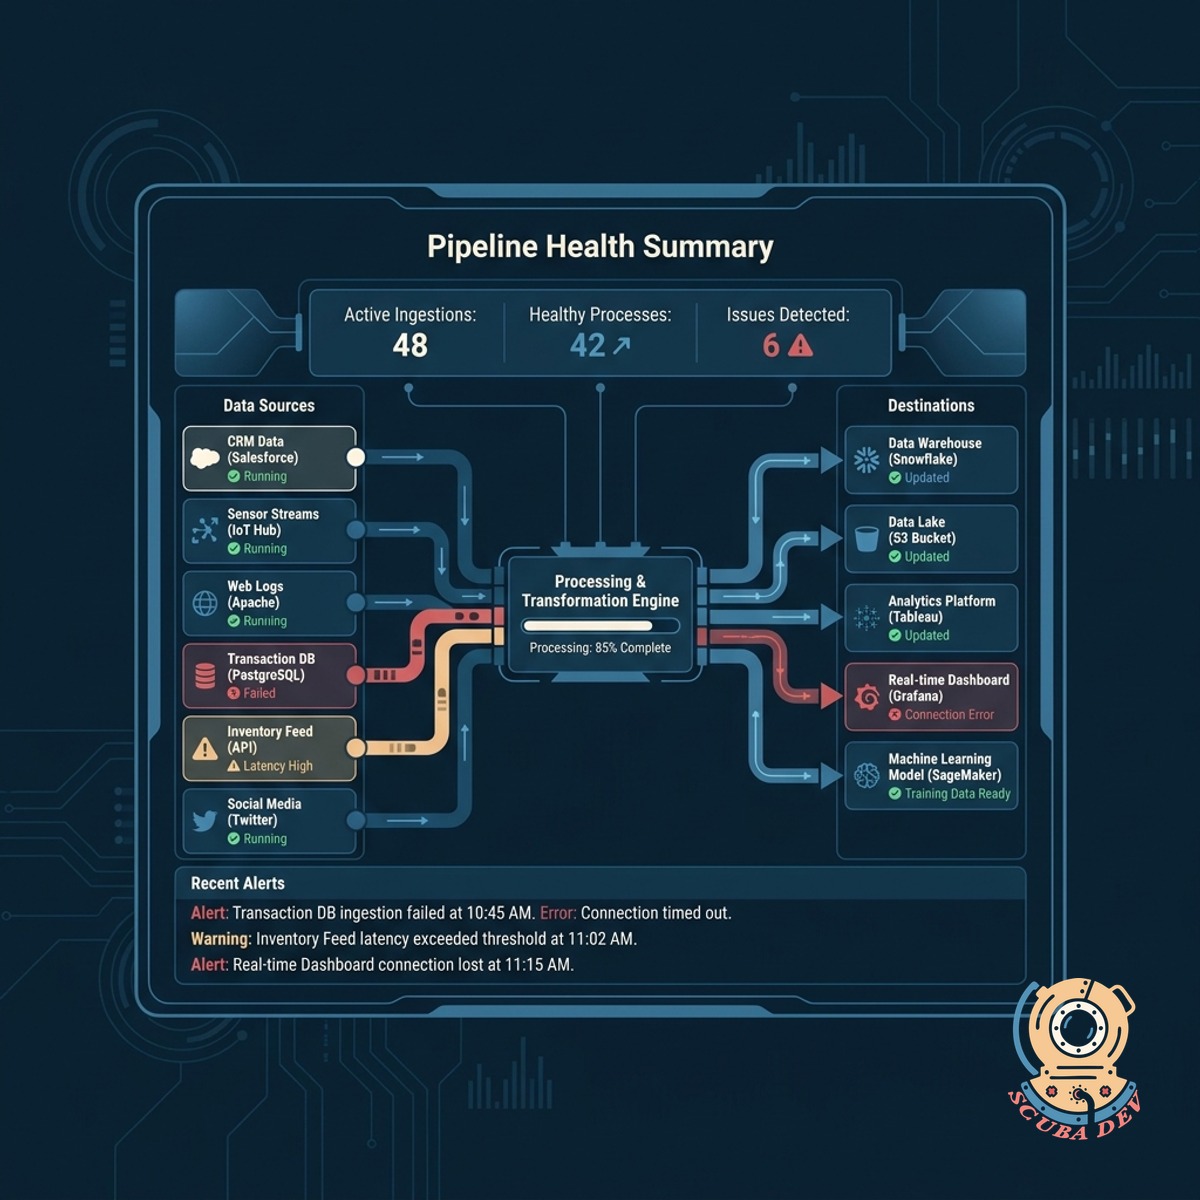
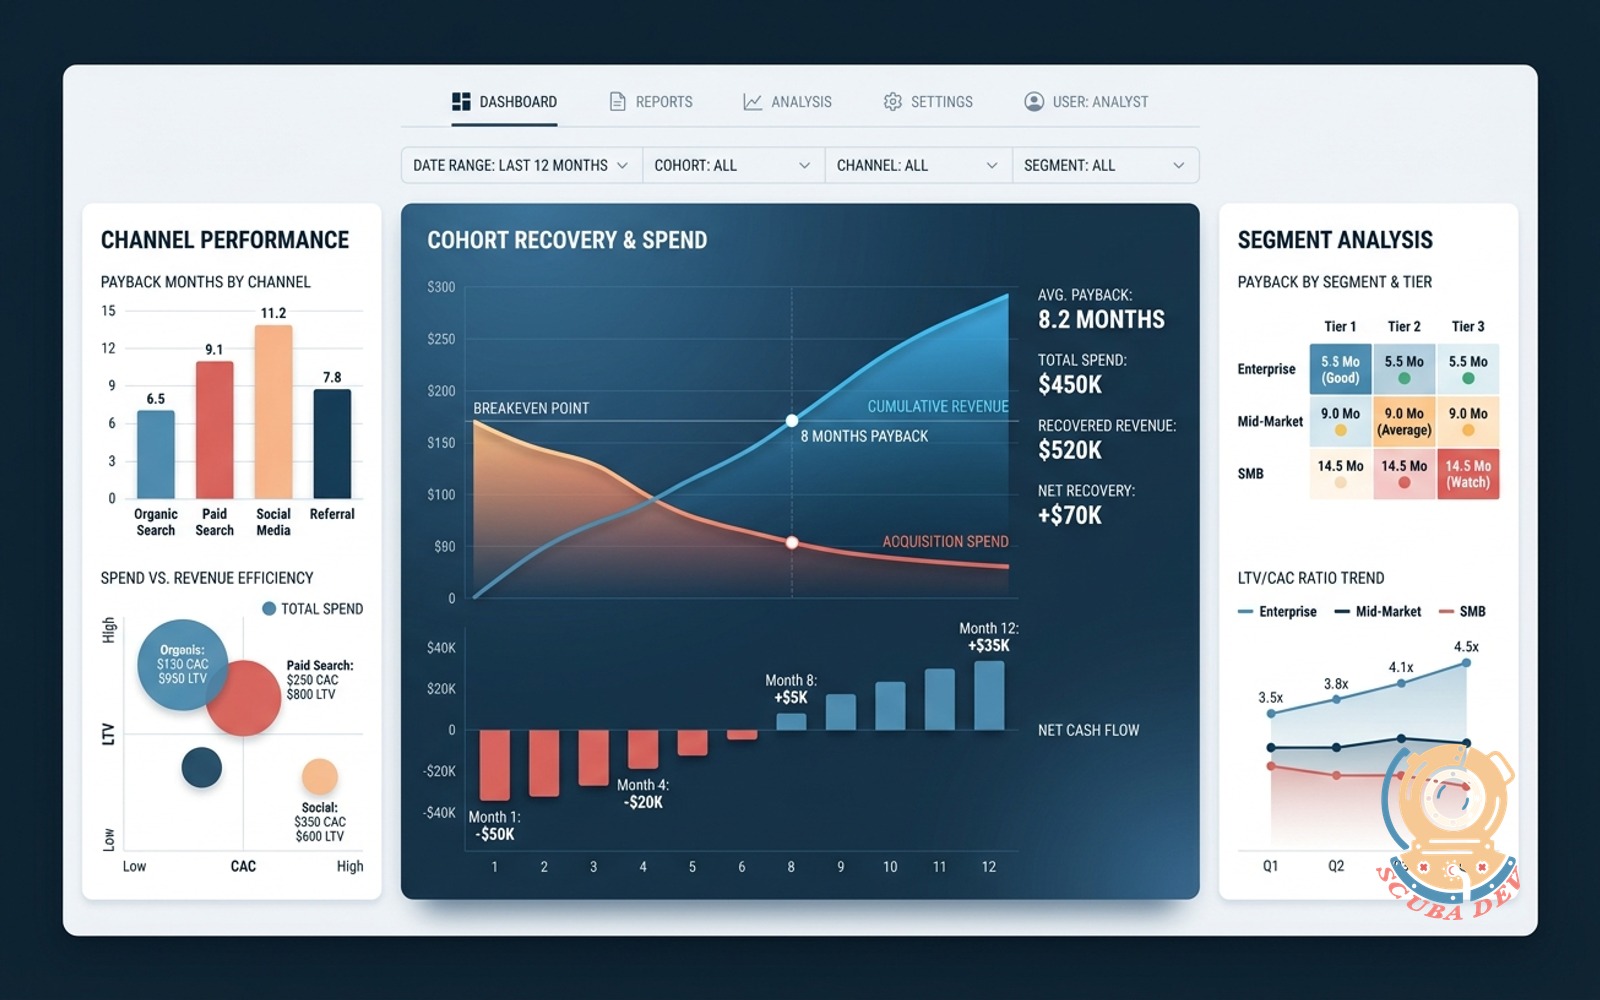
Centralized Pipeline Health View
View the status of all your data pipelines on a single screen to quickly identify upstream bottlenecks.
- Aggregate statuses across all data sources
- Filter views by project or department
- Track historical uptime and reliability
- Identify chronic sync failures quickly
Questions
Things people ask
Which data warehouses does this dashboard support?
We build the dashboard to connect directly to your existing infrastructure. It works seamlessly with Snowflake, BigQuery, Redshift, and standard relational databases like PostgreSQL.
How do we define the expected intervals for different tables?
You configure the expected frequency for each table or data source within the dashboard settings. A real time events table might expect updates every five minutes, while a financial summary table updates once daily.
Can the system notify us in Slack when a pipeline stops?
We let you configure custom update intervals for every table in your warehouse. You can set strict hourly expectations for critical events and daily checks for standard reporting tables.
Does this tool monitor external data sources like Fivetran or Airbyte?
The dashboard monitors the final destination tables in your warehouse. If an external tool like Fivetran or Airbyte fails to load data, the dashboard detects the missing updates and flags the table as stale.
How does the dashboard know when a table was last updated?
We implement a tracking mechanism that queries the metadata of your data warehouse. Alternatively, we can use an updated timestamp column within the tables themselves to verify the latest record.
Can we give our business analysts access to this dashboard?
You can route stale data alerts directly to your existing communication tools like Slack or Microsoft Teams. We use standard webhooks to ensure your data engineering team sees the warnings where they already work.
What happens if a pipeline is intentionally paused for maintenance?
You can manually mute alerts for specific tables or entire data sources during maintenance windows. The dashboard will show a paused status instead of a red flag until the maintenance period ends.