CAC payback report
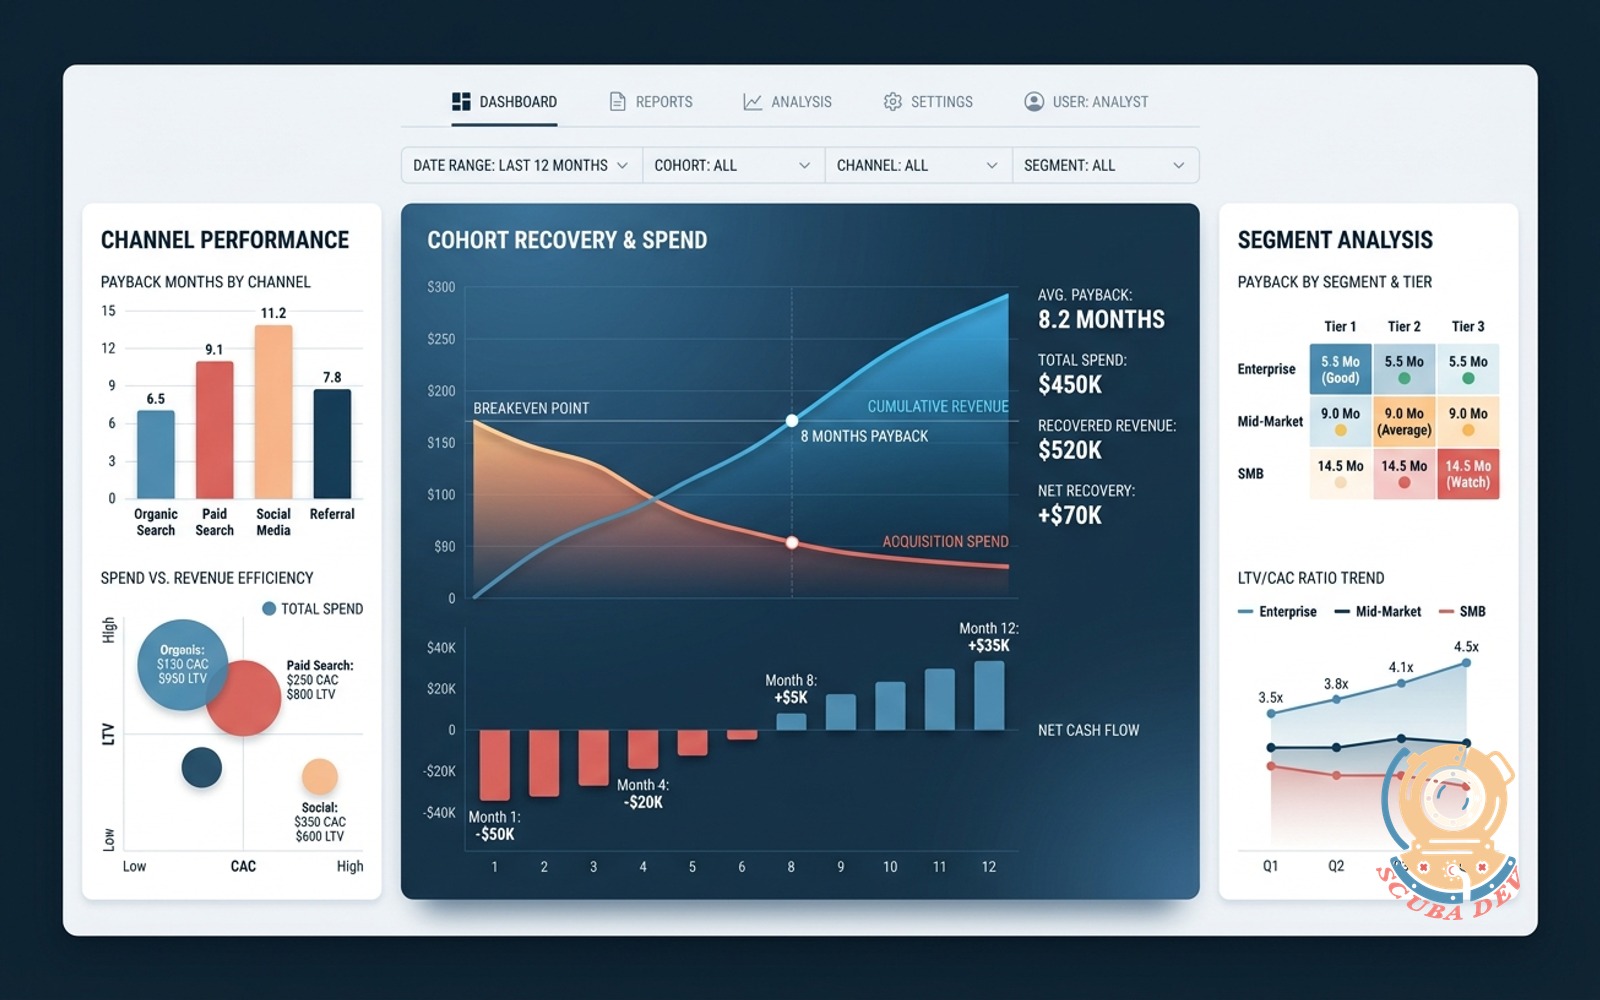
Tracks acquisition spend against cohort revenue, shows payback months by channel and segment.
Possibilities
Where this could go
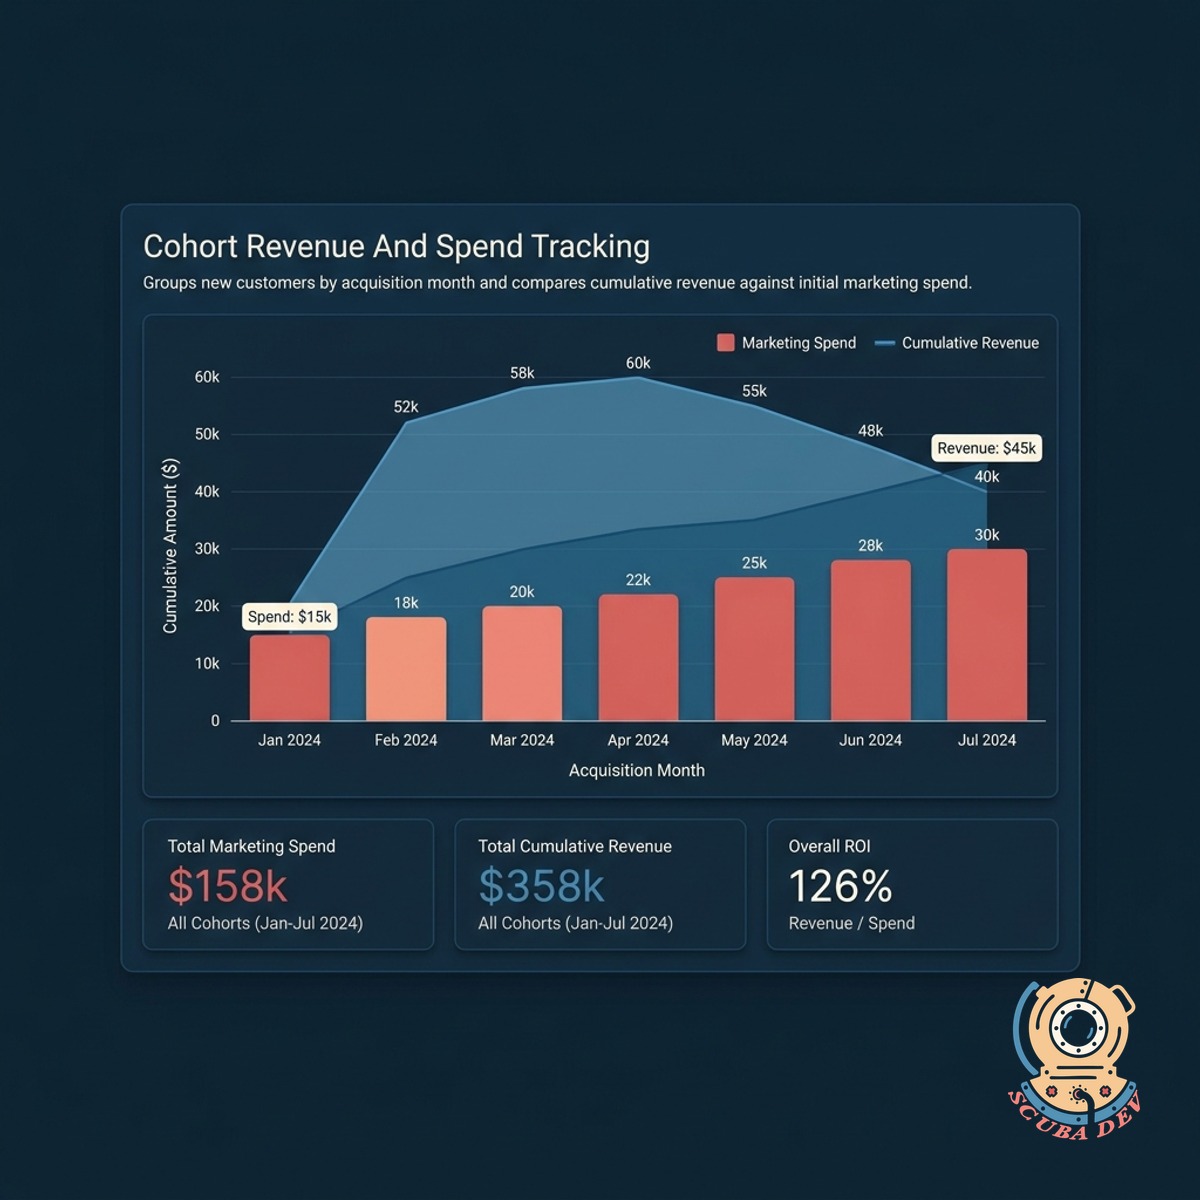
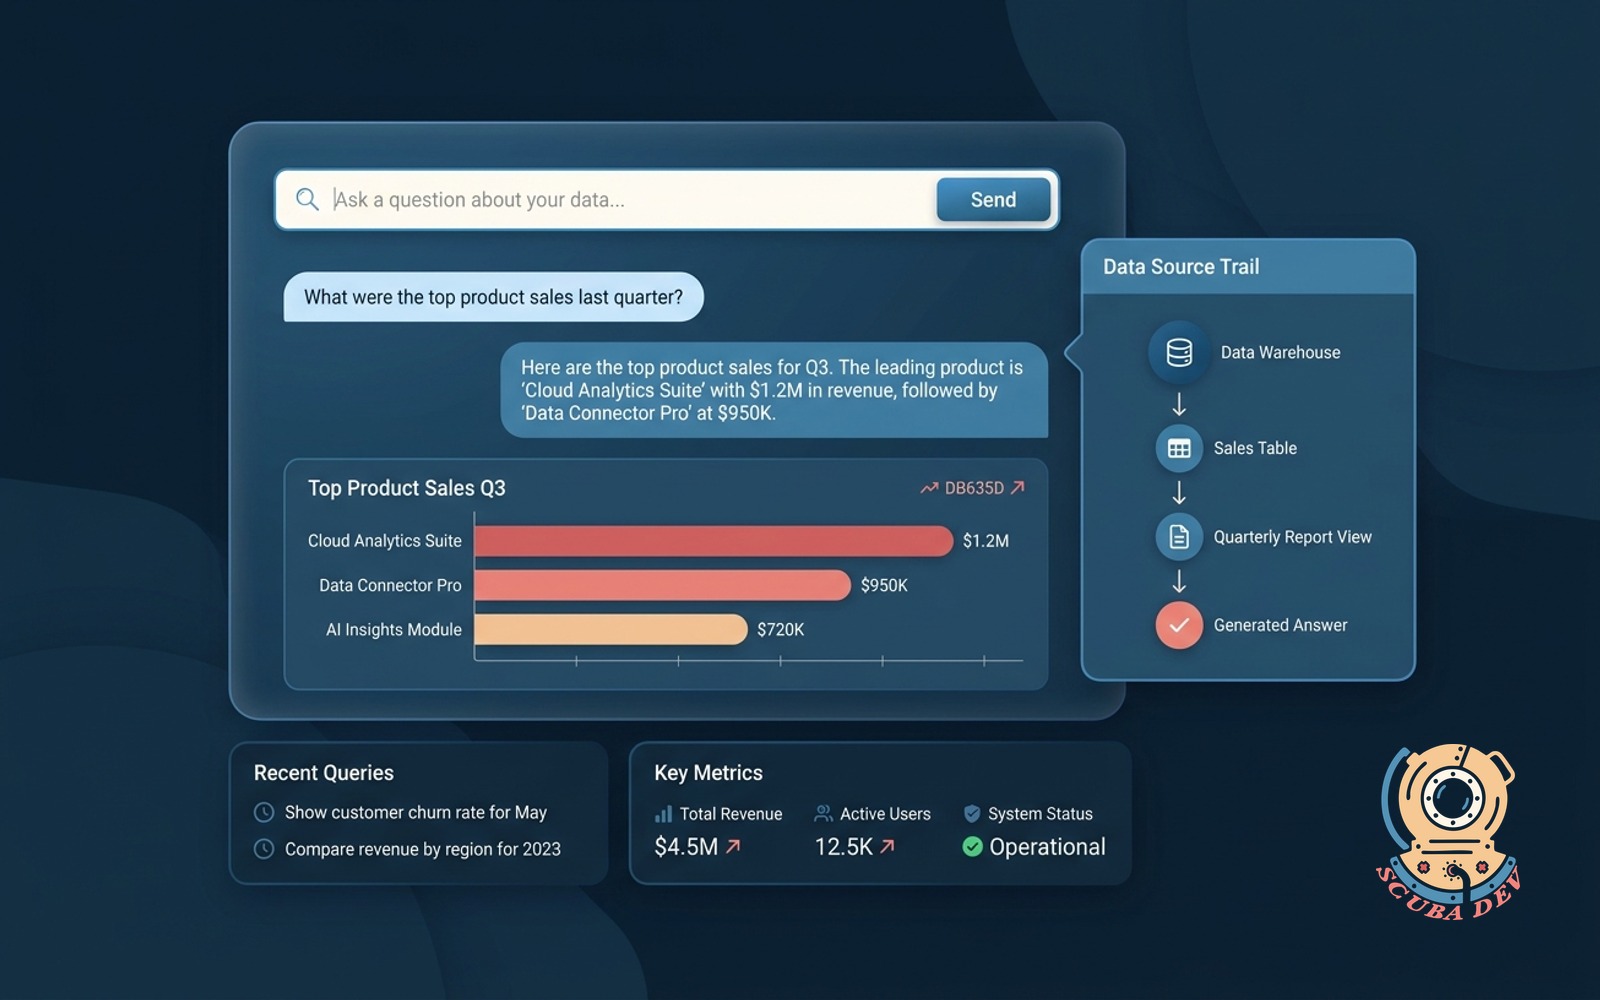
Cohort Revenue And Spend Tracking
The report groups new customers by acquisition month and compares their cumulative revenue against the initial marketing spend.
- Group customers by signup month
- Aggregate ad spend from Meta and Google
- Track cumulative Stripe revenue
- Calculate break even point automatically
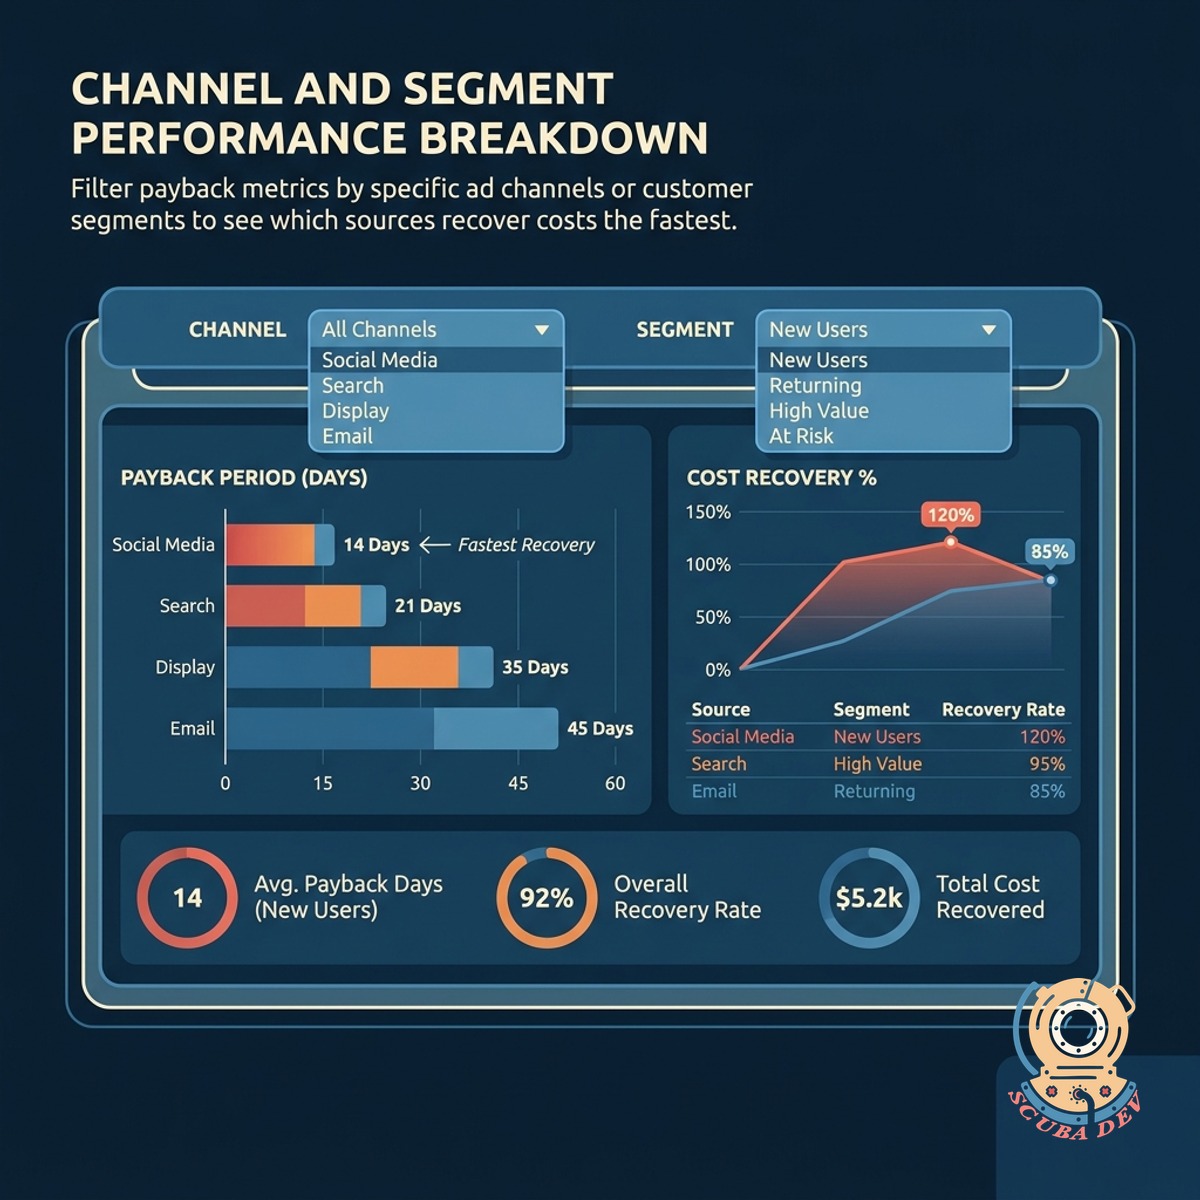
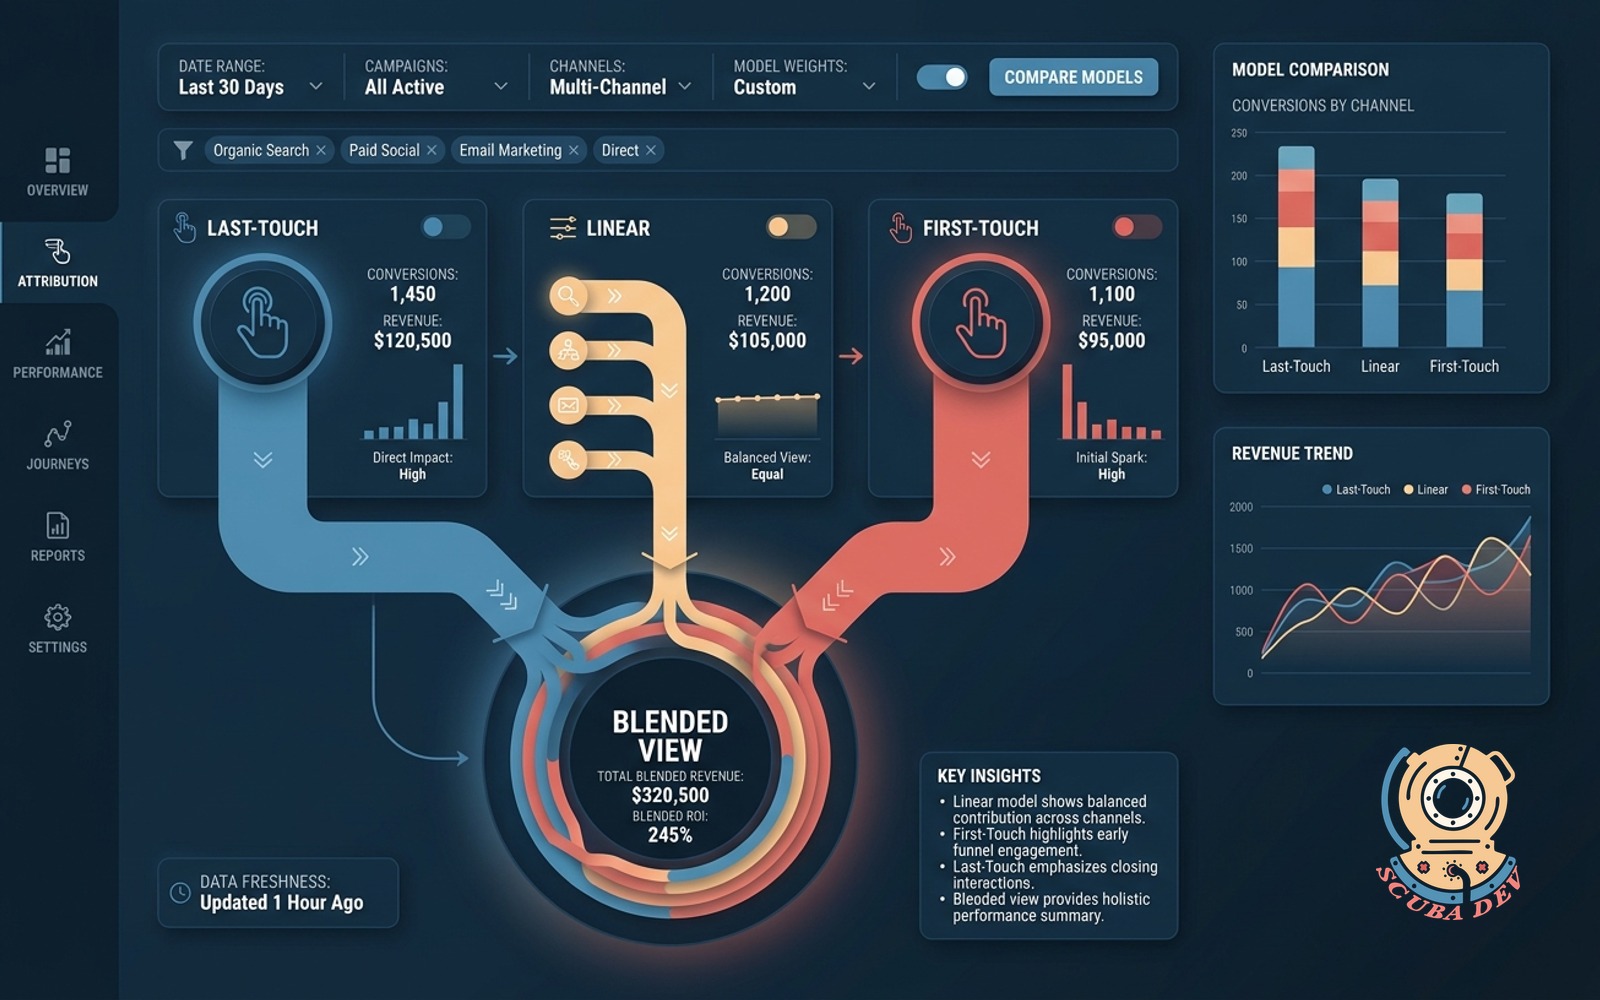
Channel And Segment Performance Breakdown
You can filter payback metrics by specific ad channels or customer segments to see which sources recover costs the fastest.
- Filter by acquisition source
- Compare B2B versus B2C segments
- Identify fastest recovering channels
- Isolate underperforming campaigns
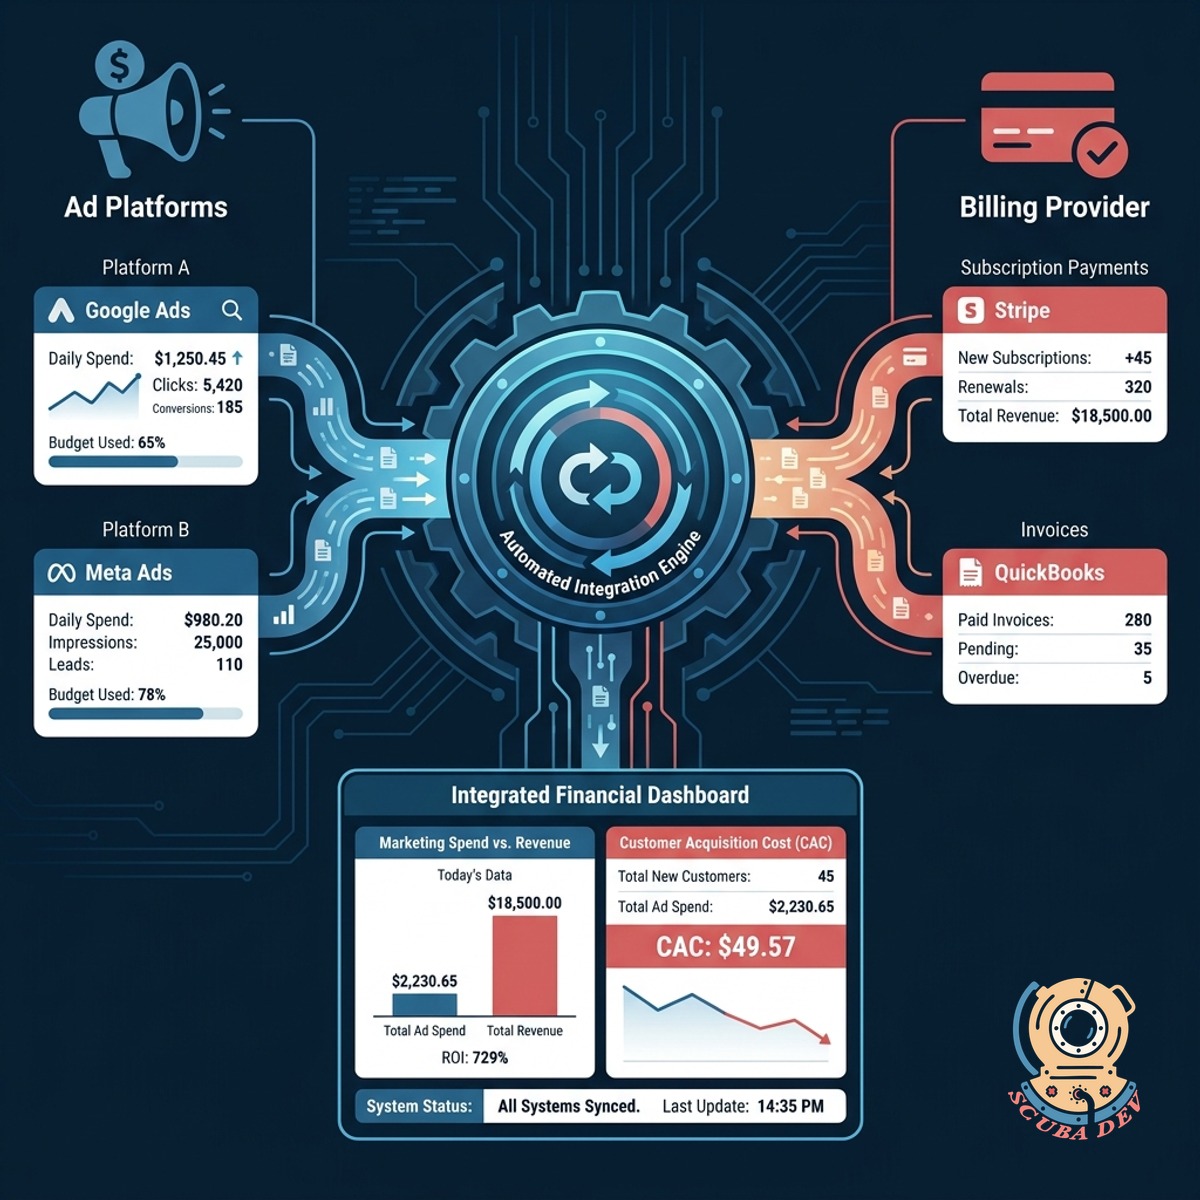
Automated Marketing And Billing Integration
The system pulls daily spend data from ad platforms and matches it with subscription payments from your billing provider.
- Connect Meta Ads and Google Ads
- Sync daily Stripe billing data
- Automate currency conversion
- Refresh metrics every twenty four hours
Questions
Things people ask
How does the system calculate the payback period?
It divides the total acquisition spend for a specific cohort by the cumulative gross margin or revenue generated by that same cohort over time. The result shows the exact month when the cohort recovers its initial cost.
Which advertising platforms can we connect to this report?
We can integrate the report with major ad networks like Google Ads, Meta Ads, LinkedIn Ads, and TikTok Ads using their native APIs or a data pipeline tool like Fivetran.
Does this work with subscription billing systems?
Yes. The report is designed to pull recurring revenue data from platforms like Stripe, Chargebee, or Recurly to accurately track customer lifetime value as it grows month over month.
Can we view payback periods for specific customer segments?
You can segment the data by any attribute tracked in your database. Common segments include geographic region, pricing tier, company size, or device type.
How frequently does the cohort revenue data update?
The data pipeline typically runs on a daily schedule. This ensures your marketing team has fresh insights every morning without overloading your database with continuous queries.
What happens if a customer upgrades or downgrades their plan?
The report tracks actual recognized revenue from your billing system. Any upgrades, downgrades, or churn events are automatically reflected in the cumulative revenue line for that specific customer cohort.
How do we handle blended acquisition costs?
We can configure the report to distribute fixed marketing costs or organic acquisition overhead across your cohorts using a custom allocation formula that fits your business model.