Retail Store Execution App
Planogram compliance photos, shrinkage reporting, task assignment from HQ, and live KPI tiles for district manager coverage.
Possibilities
Where this could go
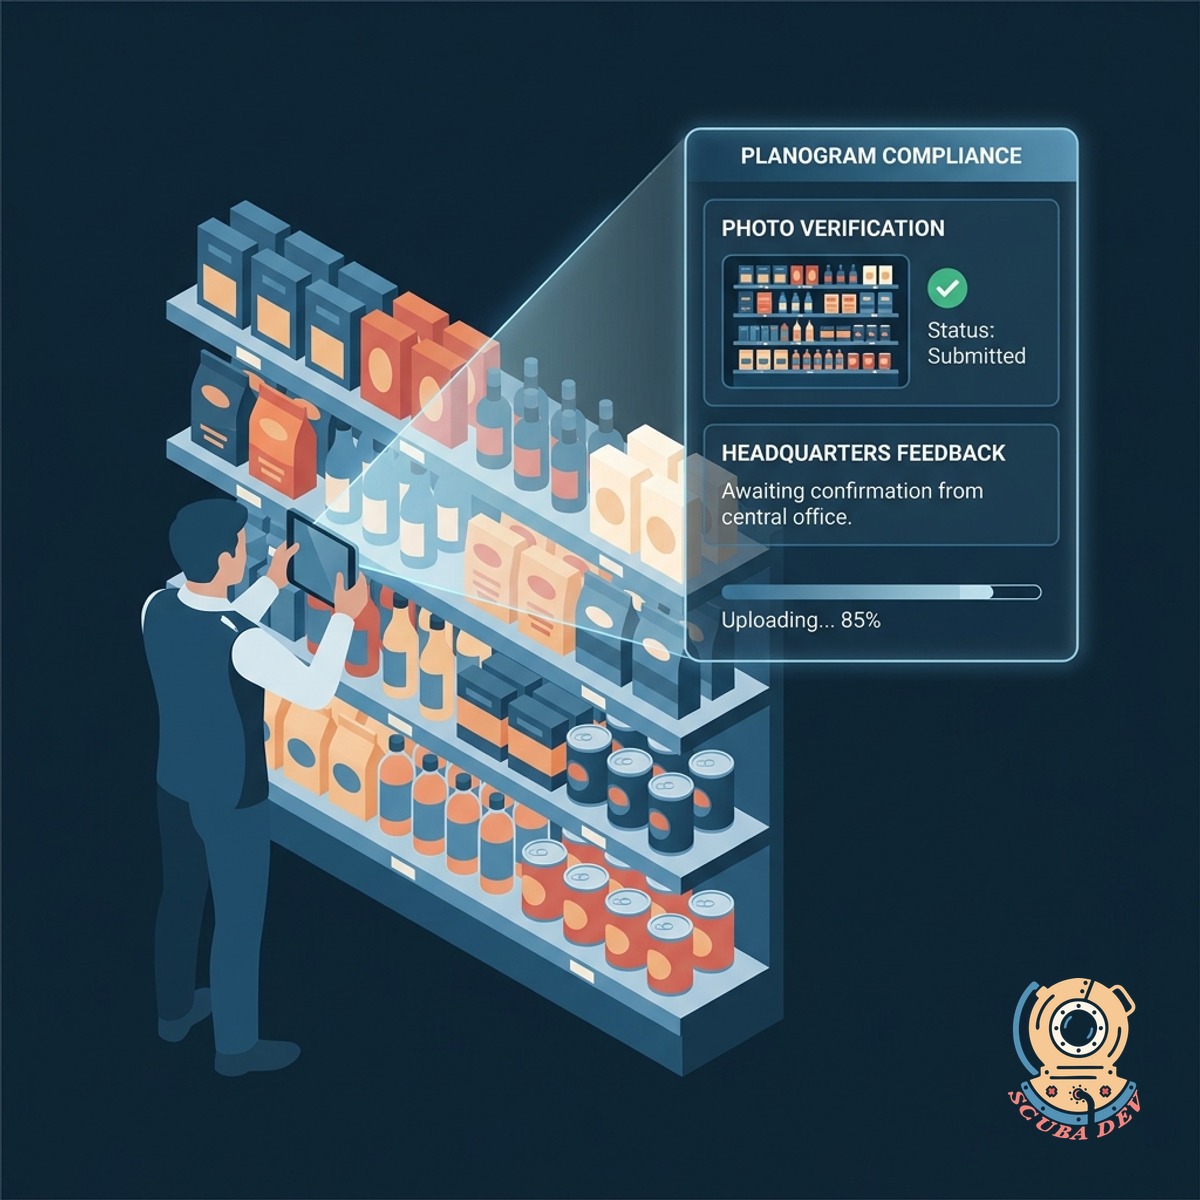
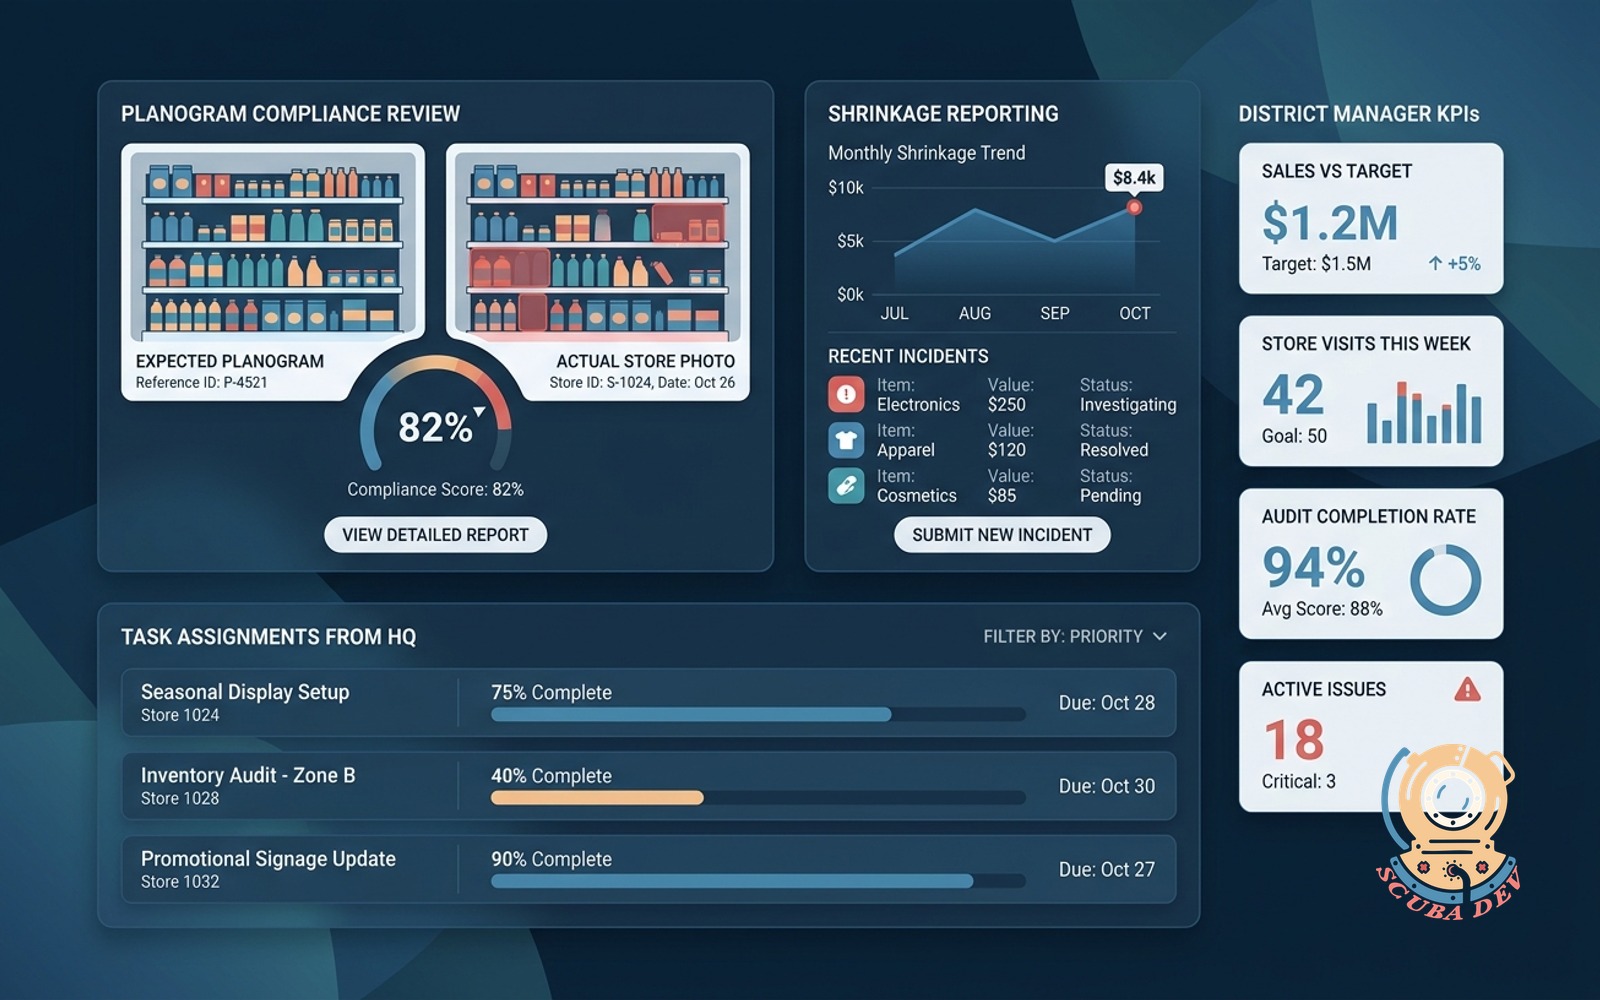
Visual Planogram Compliance And Photo Verification
Store managers snap photos of product displays to verify planogram compliance directly with headquarters.
- Upload shelf photos directly to HQ
- Compare live displays against guidelines
- Flag incorrect signage or pricing
- Store historical visual merchandising data

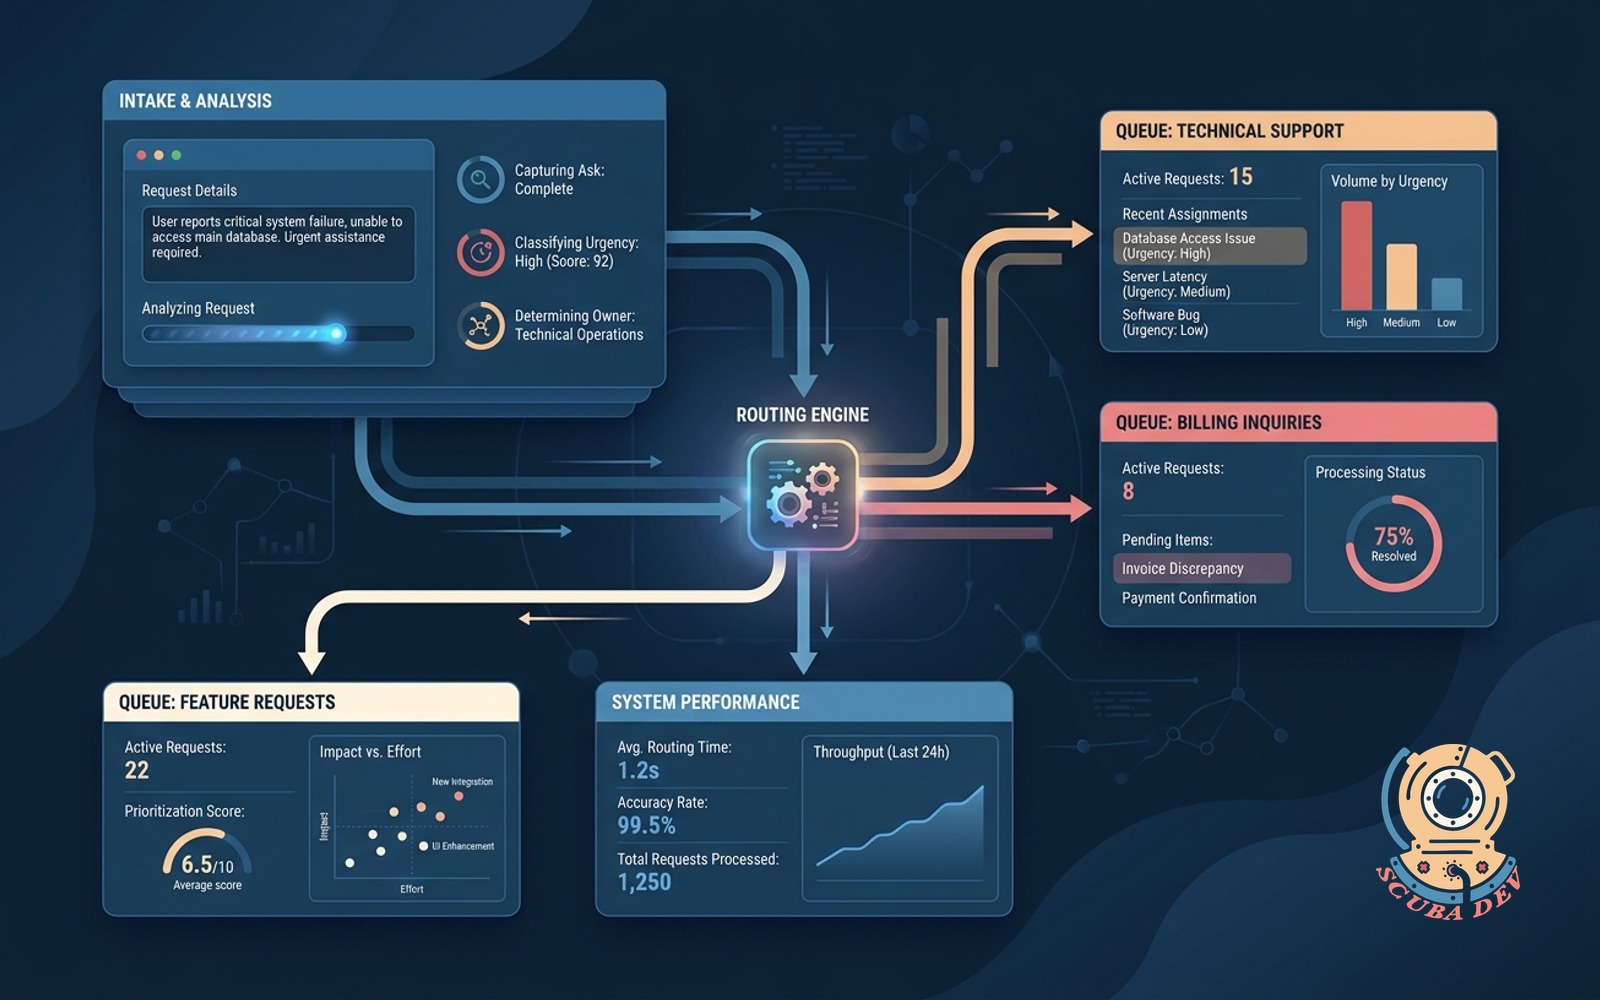
Task Assignment And Direct Shrinkage Reporting
Headquarters assigns daily operational tasks to store teams and collects structured shrinkage reports in one system.
- Receive daily task lists from headquarters
- Log damaged or missing inventory instantly
- Track task completion across all locations
- Route shrinkage data to inventory systems
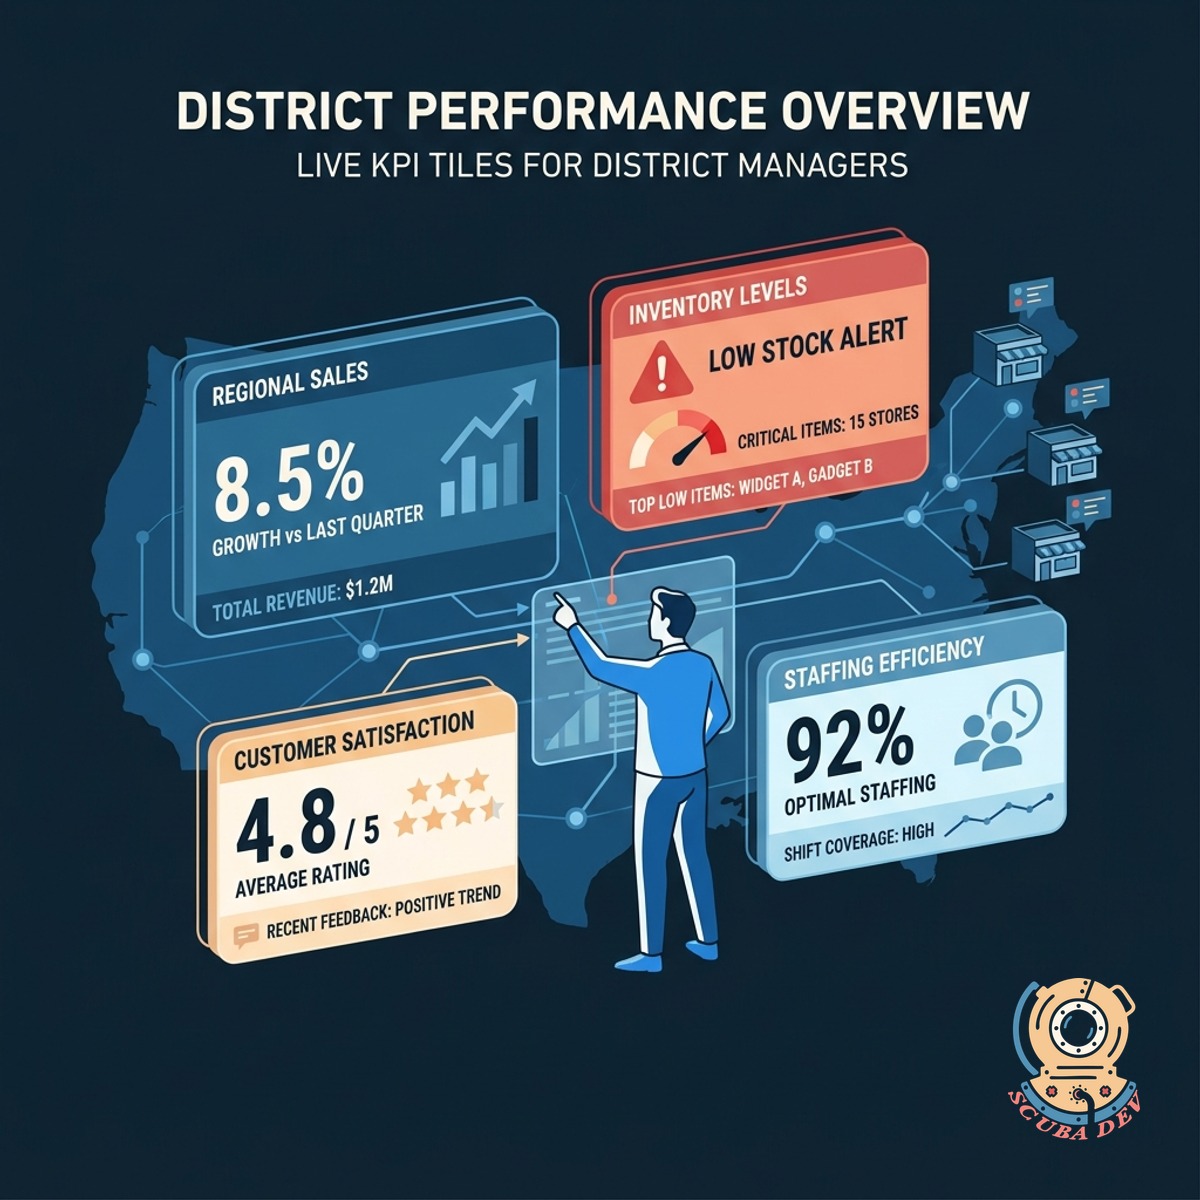
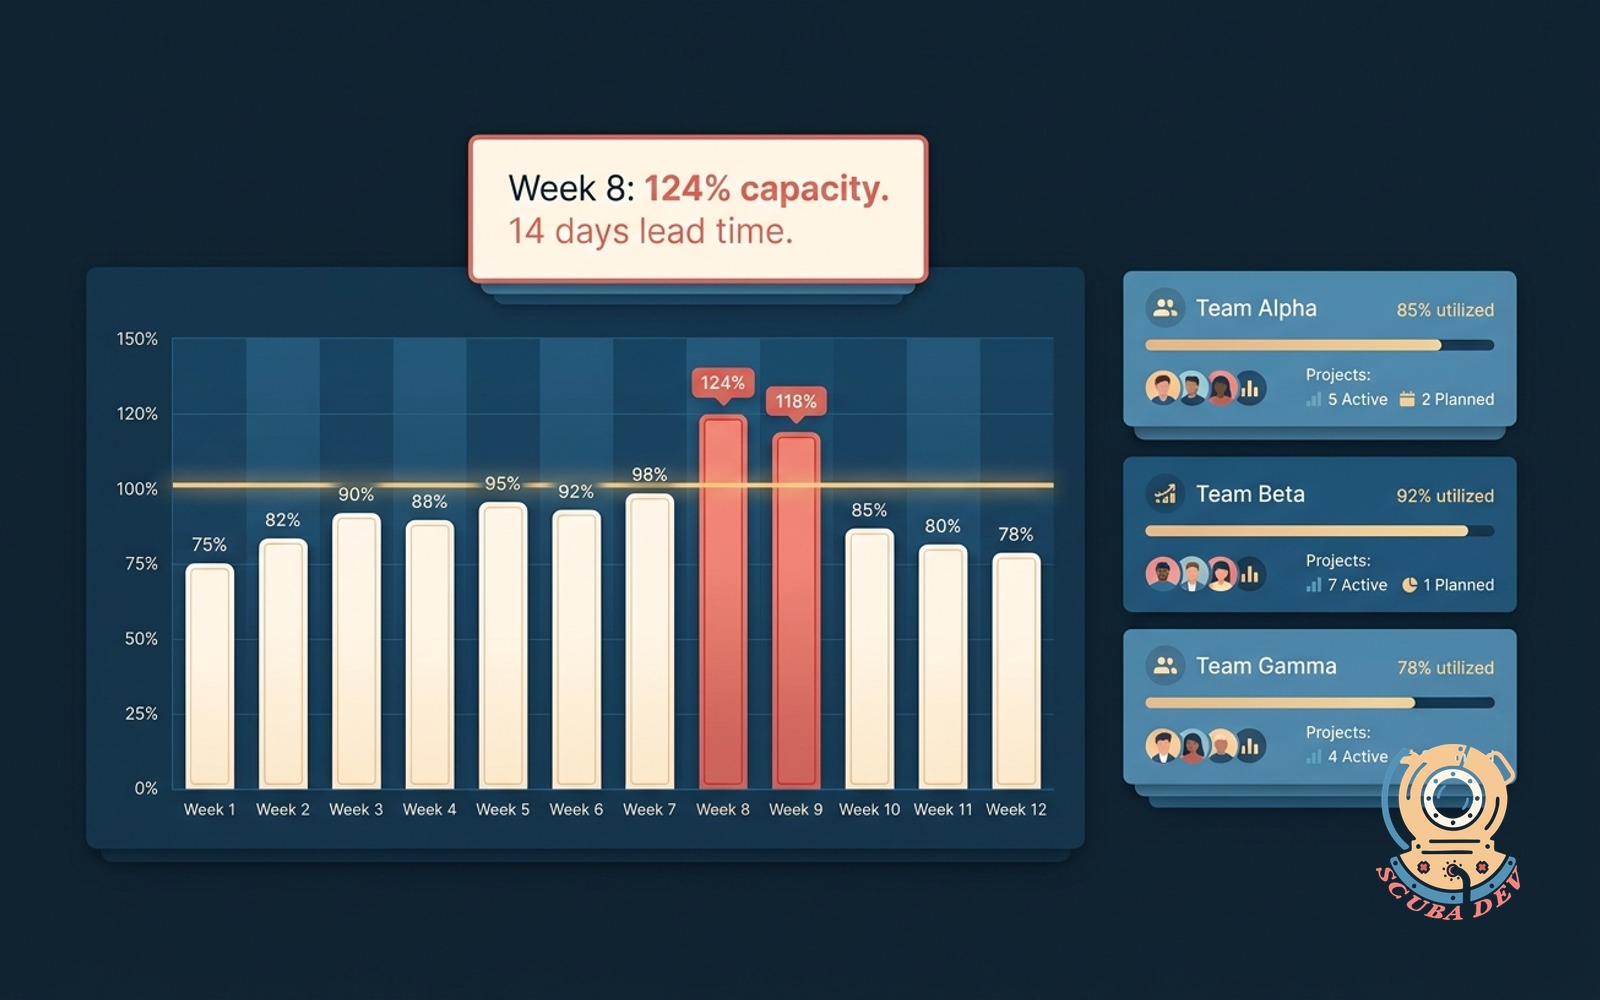
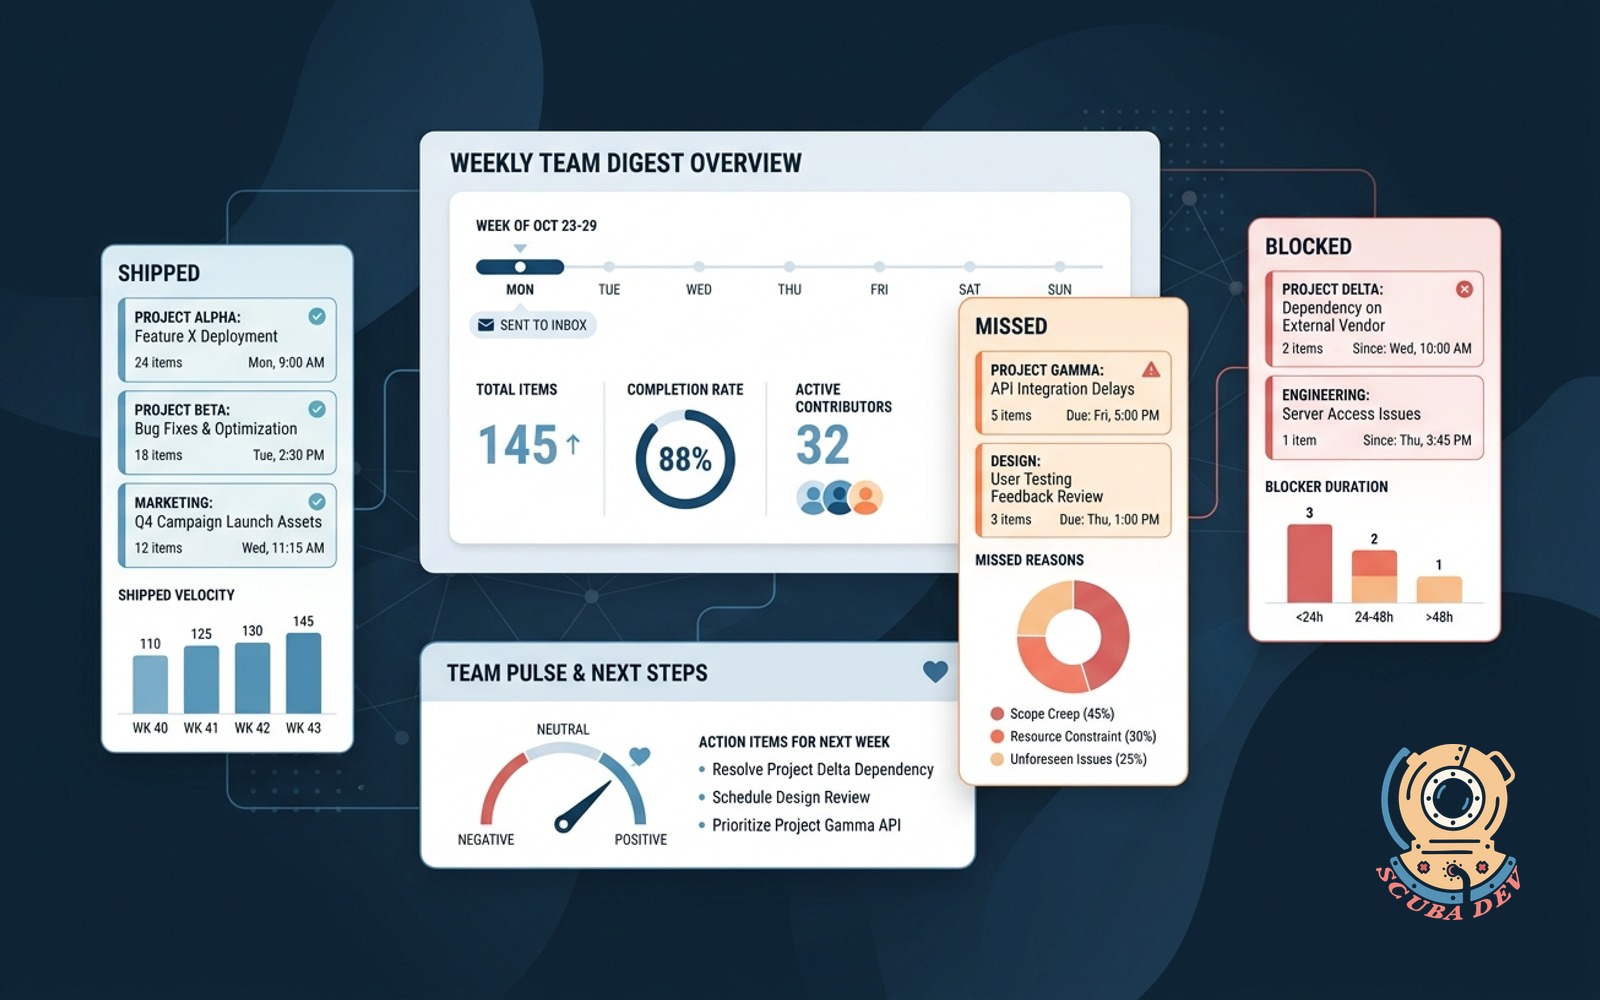
Live KPI Tiles For District Managers
District managers monitor regional performance through live data tiles that aggregate store metrics.
- View aggregated sales and compliance data
- Monitor individual store task completion
- Identify locations requiring immediate support
- Export regional performance reports to Salesforce
Questions
Things people ask
How do store managers upload planogram photos?
Store managers use the mobile application to take pictures of their displays. The app automatically tags the photos with the store location and timestamps them before sending the data to headquarters.
Can headquarters assign tasks to specific retail locations?
Yes. Headquarters can select individual stores or entire districts to receive specific task assignments. Store managers see these tasks populate in their daily workflow queue.
How does the application handle shrinkage reporting?
Store employees log missing or damaged items directly into the app using barcode scanners or manual entry. This data is then routed to your central inventory management system like NetSuite or SAP.
What metrics can district managers see on their KPI tiles?
District managers view live data on task completion rates, planogram compliance scores, and reported shrinkage. They can filter these metrics by individual store or view an aggregate of their entire territory.
Does this tool integrate with our existing communication platforms?
The application can send automated notifications to platforms like Slack or Microsoft Teams. For example, district managers can receive a Slack alert when a critical compliance task is completed.
Is the application available on mobile devices and tablets?
The tool is built as a responsive web application that functions on smartphones, tablets, and desktop computers. Store associates typically use the mobile view while headquarters staff use the desktop interface.
Can we export compliance data for our executive team?
All compliance and task data can be exported as CSV files or routed to business intelligence tools like Tableau. This allows your executive team to review historical execution trends across all retail locations.