Capacity planning dashboard
Plots team load against committed work by week. Flags the weeks where demand breaks capacity with enough lead time.
Possibilities
Where this could go
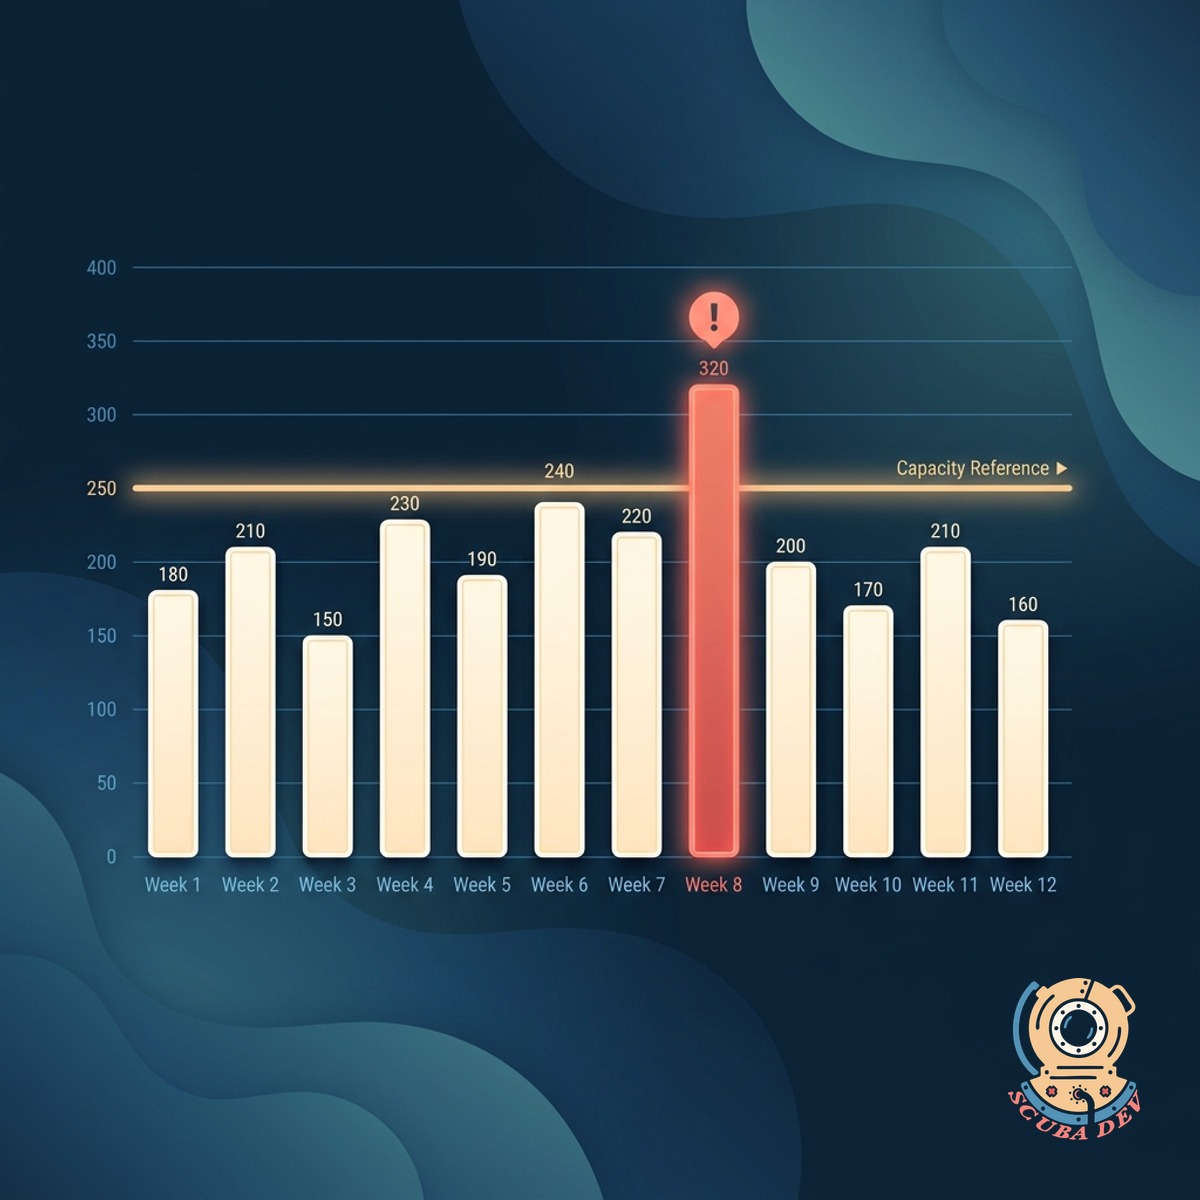
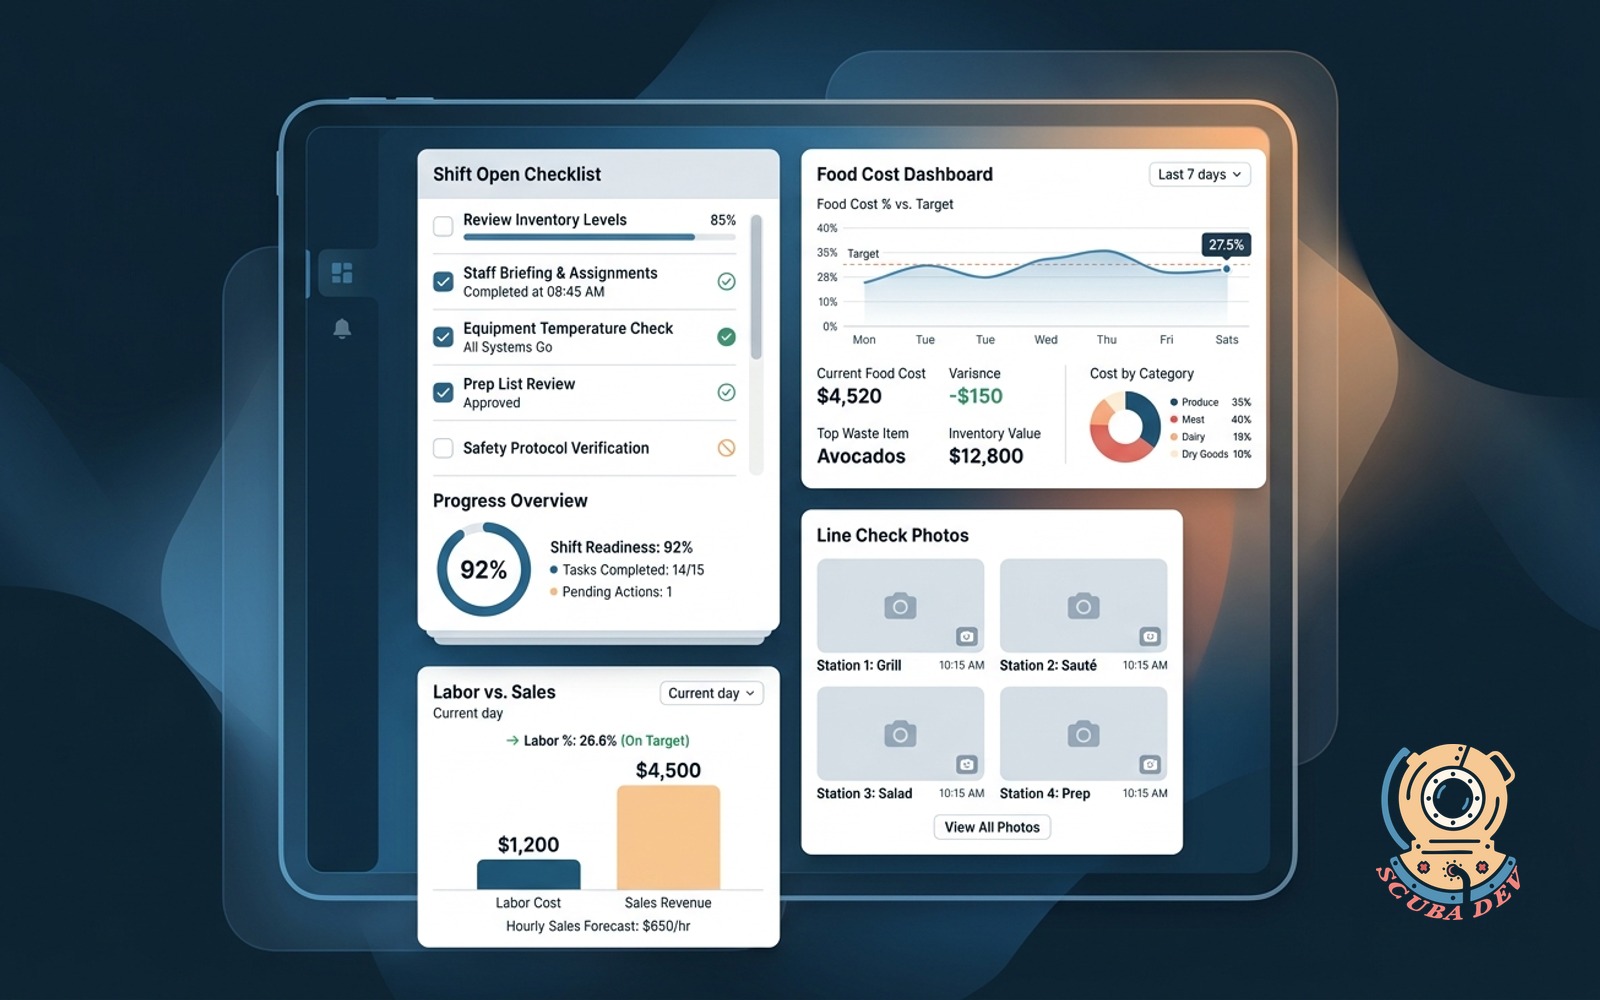
Load Vs Capacity, By Week
Plots team load against committed work per week. The gaps and overruns are visible before they become a scramble.
- Load pulled from project management and time tracking
- Capacity adjusted for PTO, holidays, and known interrupts
- Weekly bars with load, capacity, and delta
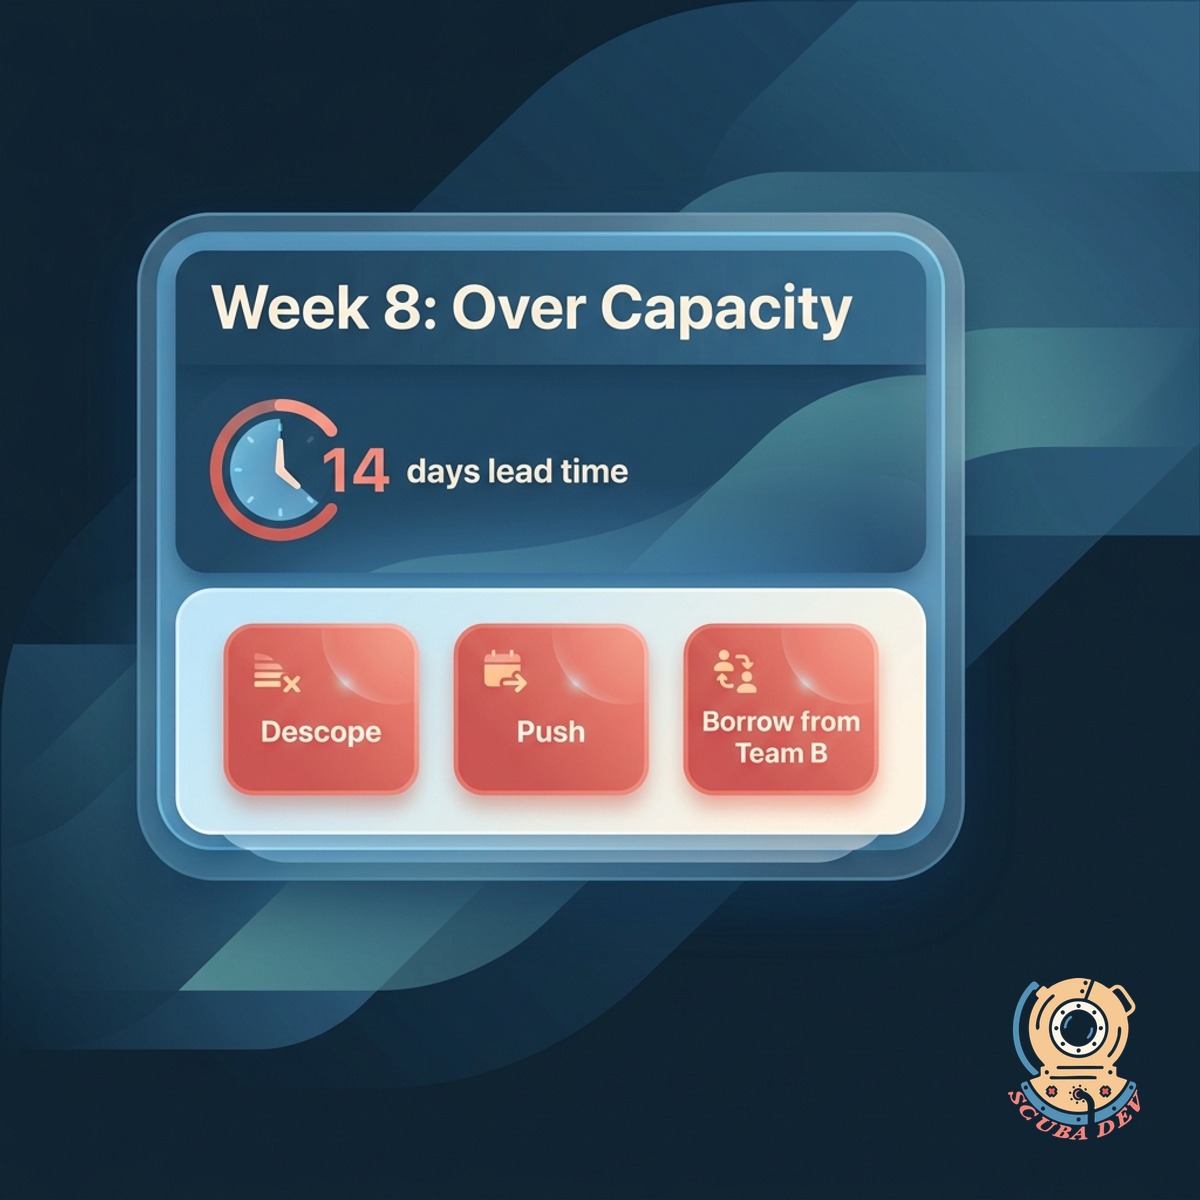
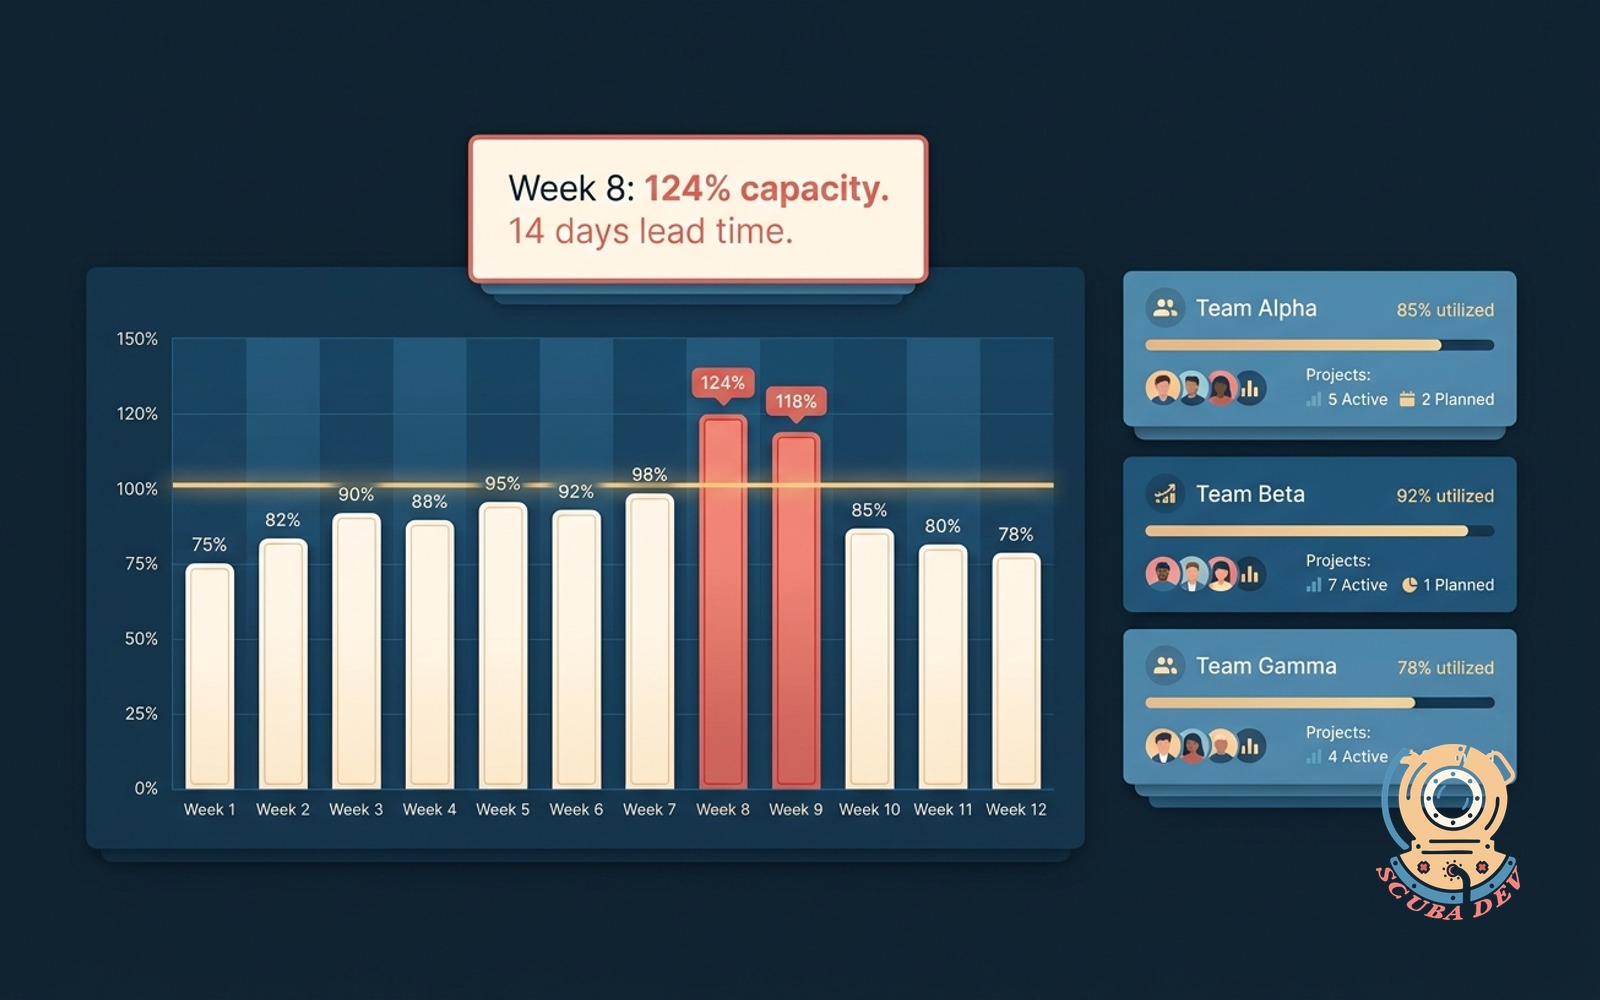
Flags The Break Before It Happens
When load crosses capacity more than two weeks out, you get a warning. Enough lead time to hire, descope, or push.
- Warning at two weeks lead time
- Critical alert at three days lead time
- Suggestions: descope, push, or borrow from another team
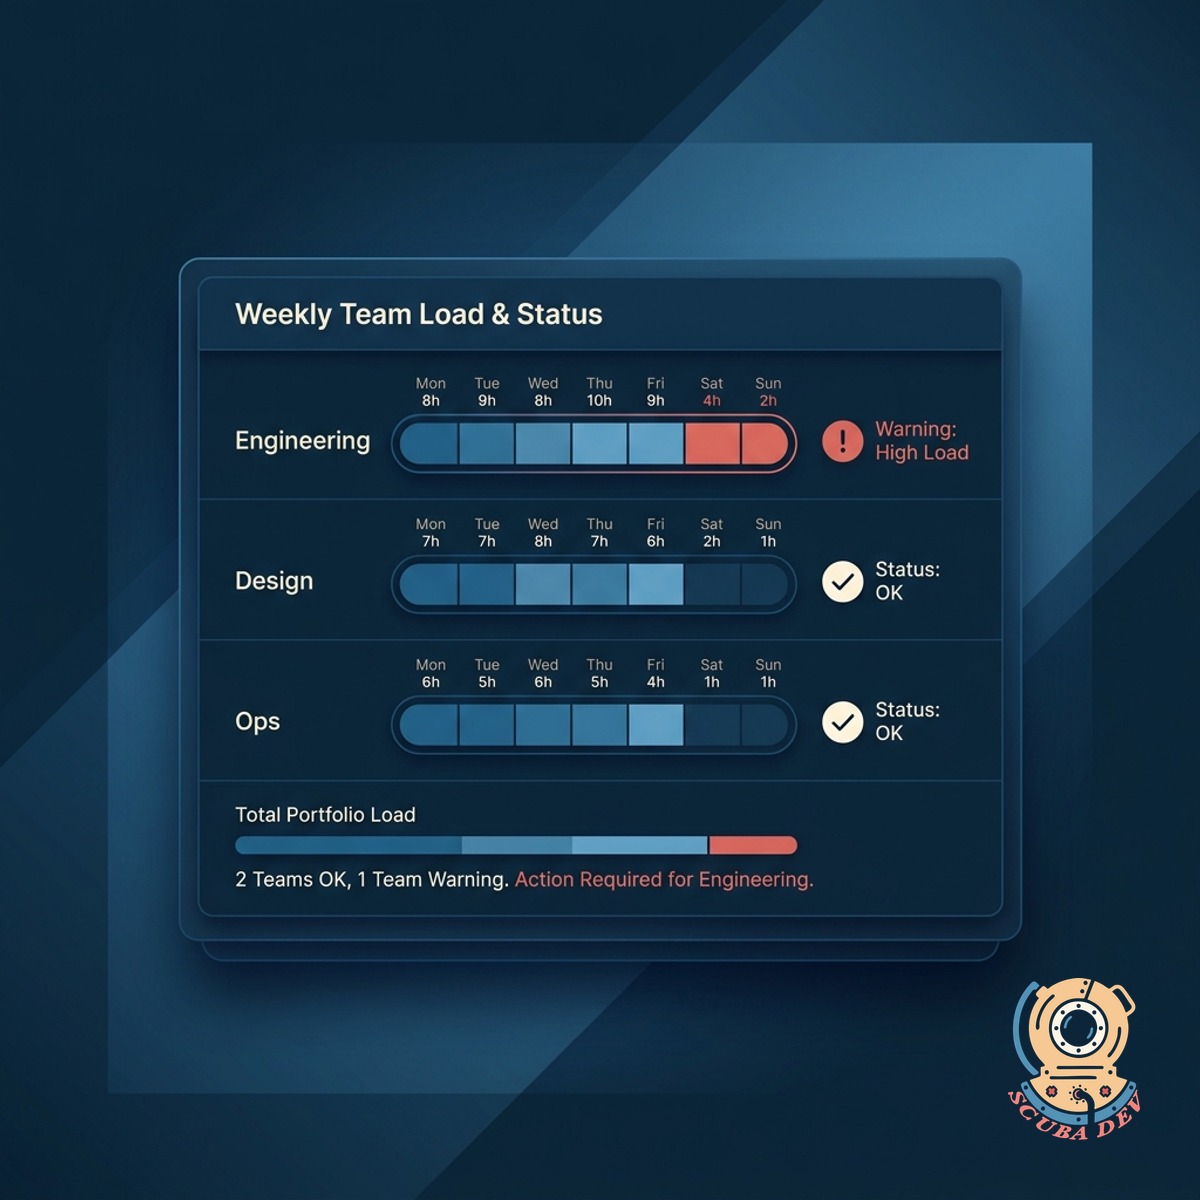
Team View And Portfolio View
Each team has their own load view. Leadership sees the portfolio rolled up so bottlenecks across teams surface fast.
- Per-team dashboards for team leads
- Portfolio rollup for leadership with cross-team dependencies
- Forecast confidence indicators on outer-week projections
Questions
Things people ask
Where does load data come from?
Jira, Linear, Asana, Monday, ClickUp, Trello, and GitHub Issues. Time tracking from Harvest, Toggl, or custom time sheets pulls the actuals.
How is capacity calculated?
Team size adjusted for PTO, holidays, interrupts, and meeting load. You set the defaults and override them per person as needed.
Can we forecast beyond committed work?
Yes. Likely upcoming work based on pipeline signals, seasonal patterns, or contracted delivery dates is folded in. Forecast confidence drops as you look further out.
How do we handle cross-team dependencies?
Dependencies show up on both team dashboards. If one team slips and another relies on them, both get flagged with the downstream impact visible.
Can specialists be fractionally allocated?
Yes. People can split across teams at configurable percentages. The math respects the split when computing capacity.
Does this replace our resourcing tool?
For most teams yes. Larger orgs using Float or Resource Guru can keep those and use this for the planning conversation. We can push data both ways.
How often does the forecast refresh?
Daily. Manual refresh available any time. If a major scope change lands mid-week, the dashboard picks it up on the next sync.