Self Serve Report Builder
Drag and drop report builder for non analysts, backed by a governed metrics layer.
Possibilities
Where this could go
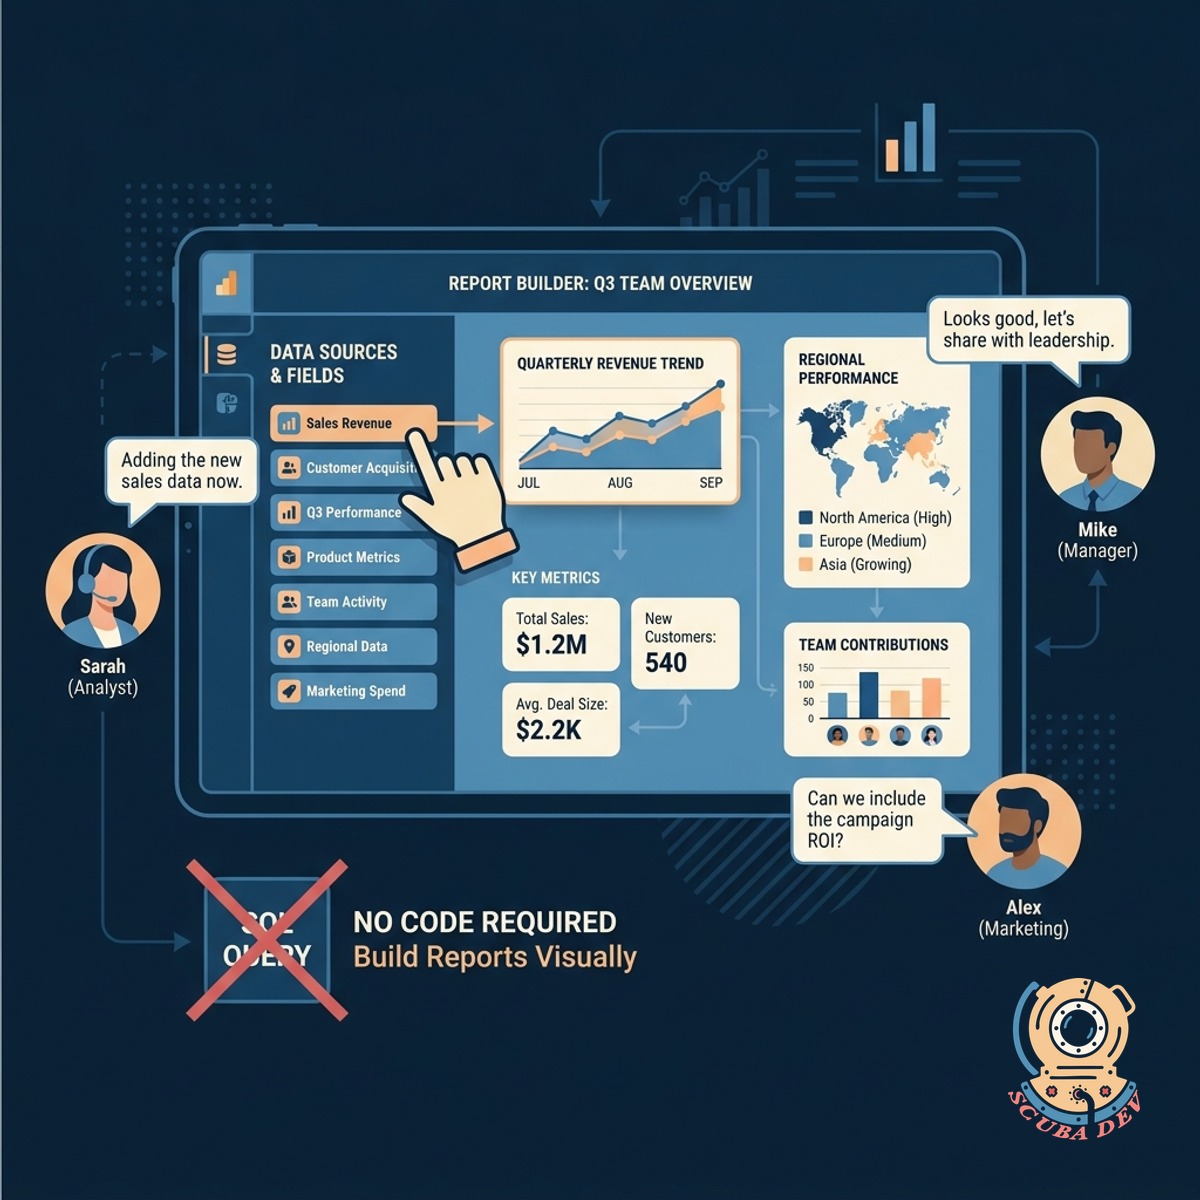
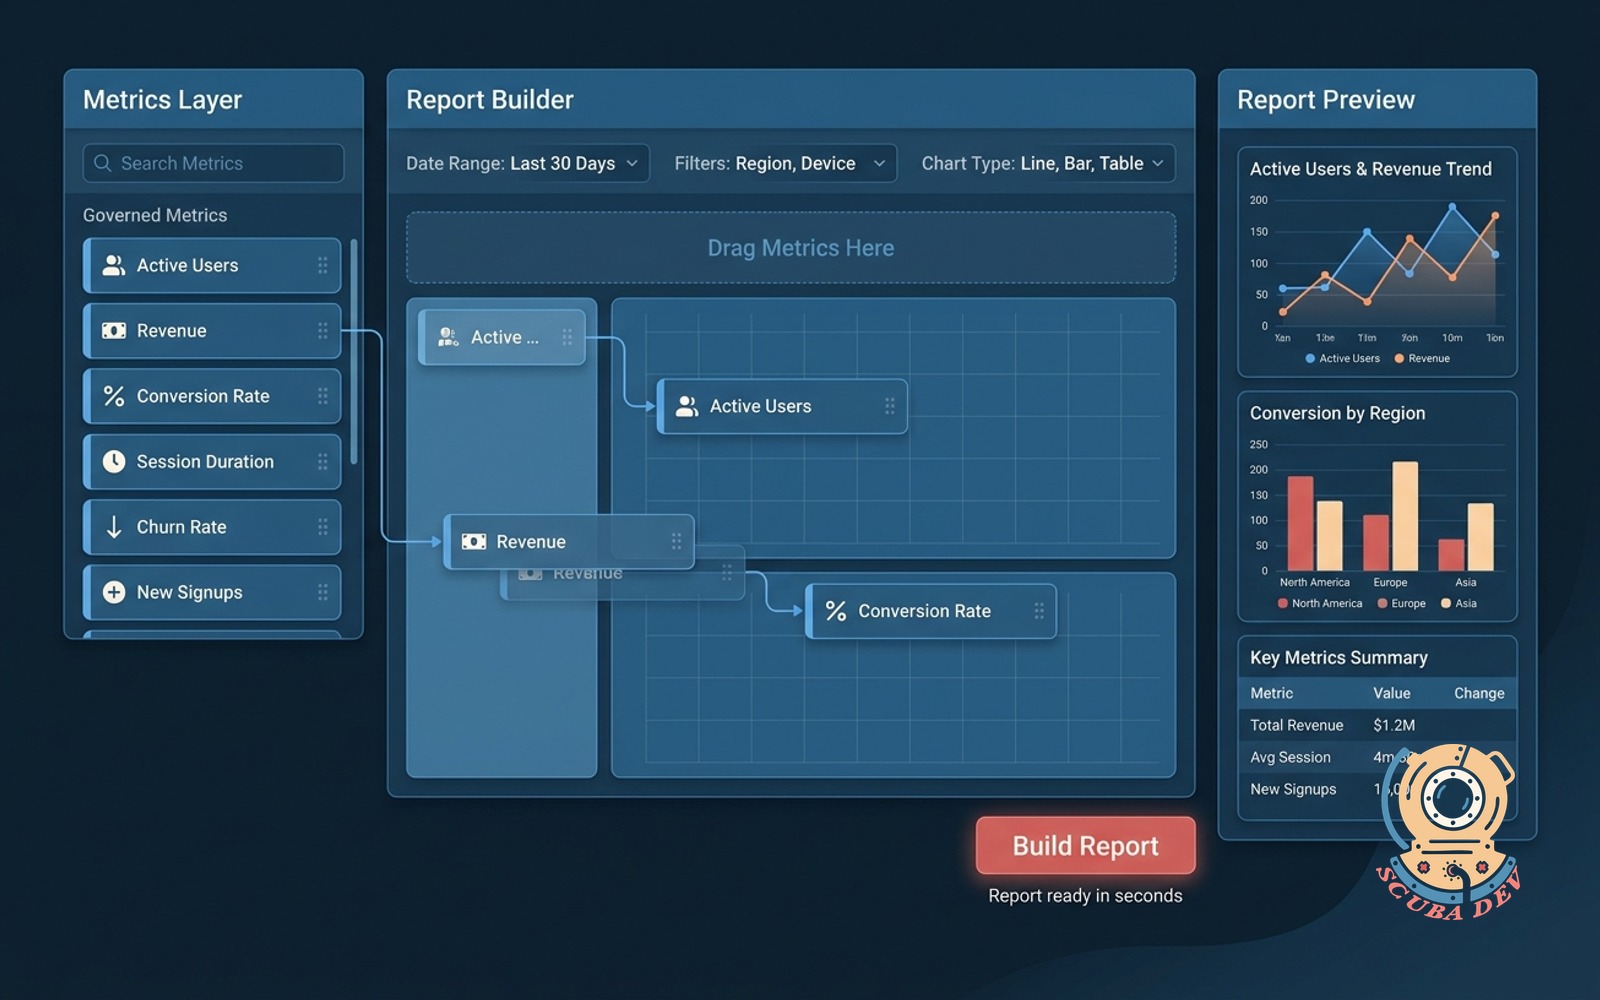
Drag And Drop Interface For Teams
Give business users the ability to build their own reports without writing a single line of SQL.
- Select dimensions and measures
- Filter data visually
- Choose chart types
- Export results to CSV
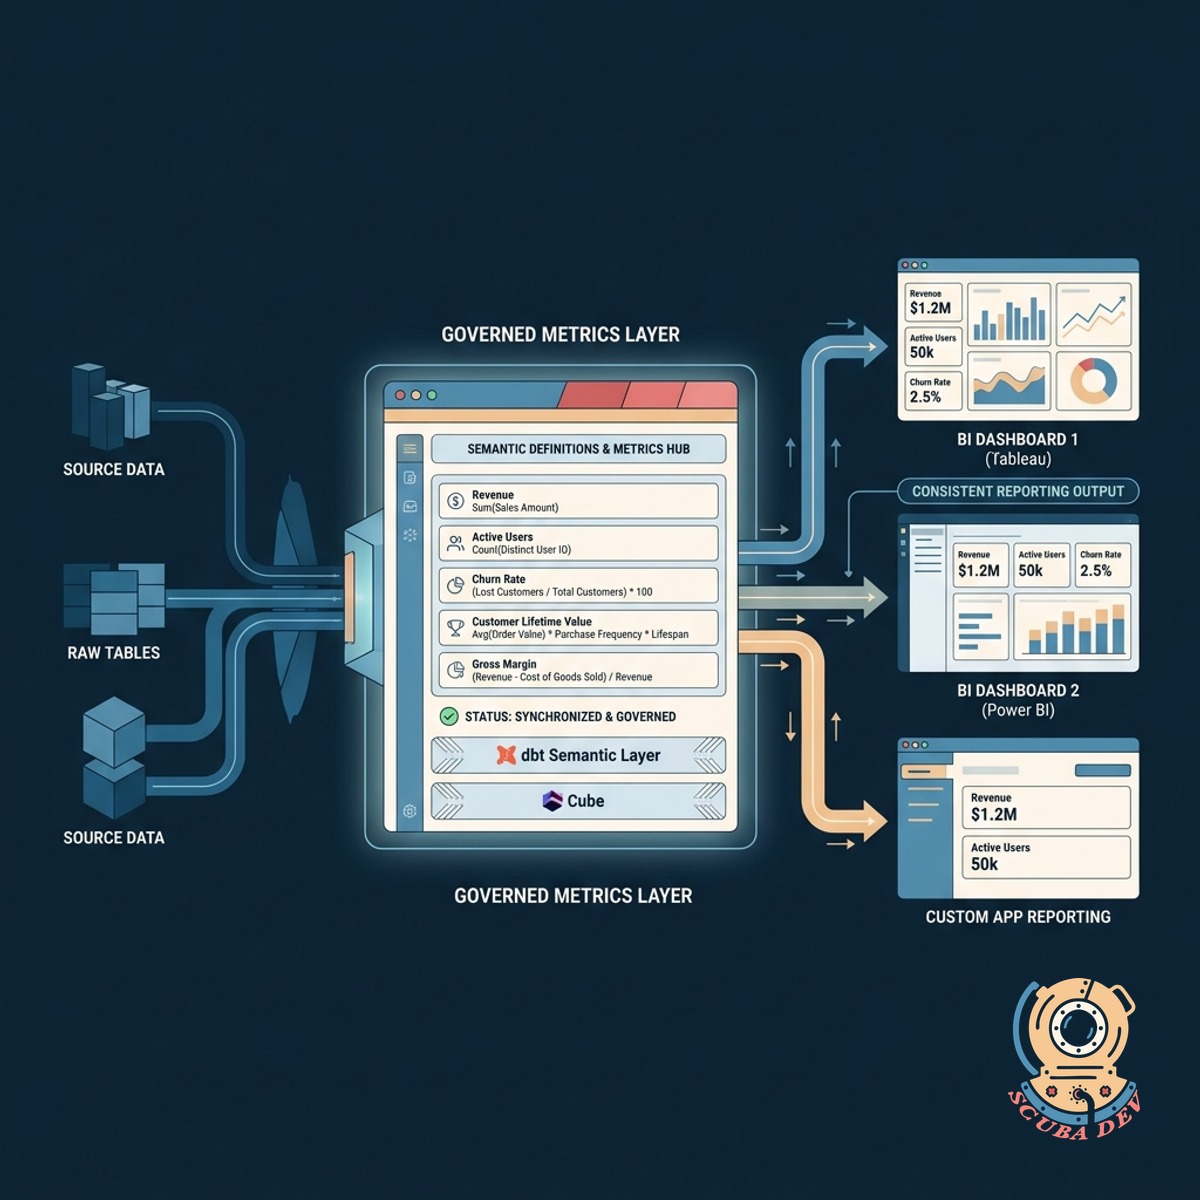
Governed Metrics Layer For Consistent Data
Connect your reporting tool to a semantic layer like dbt or Cube to ensure everyone uses the exact same definitions.
- Centralize metric definitions
- Prevent calculation errors
- Sync with dbt Cloud
- Maintain version control
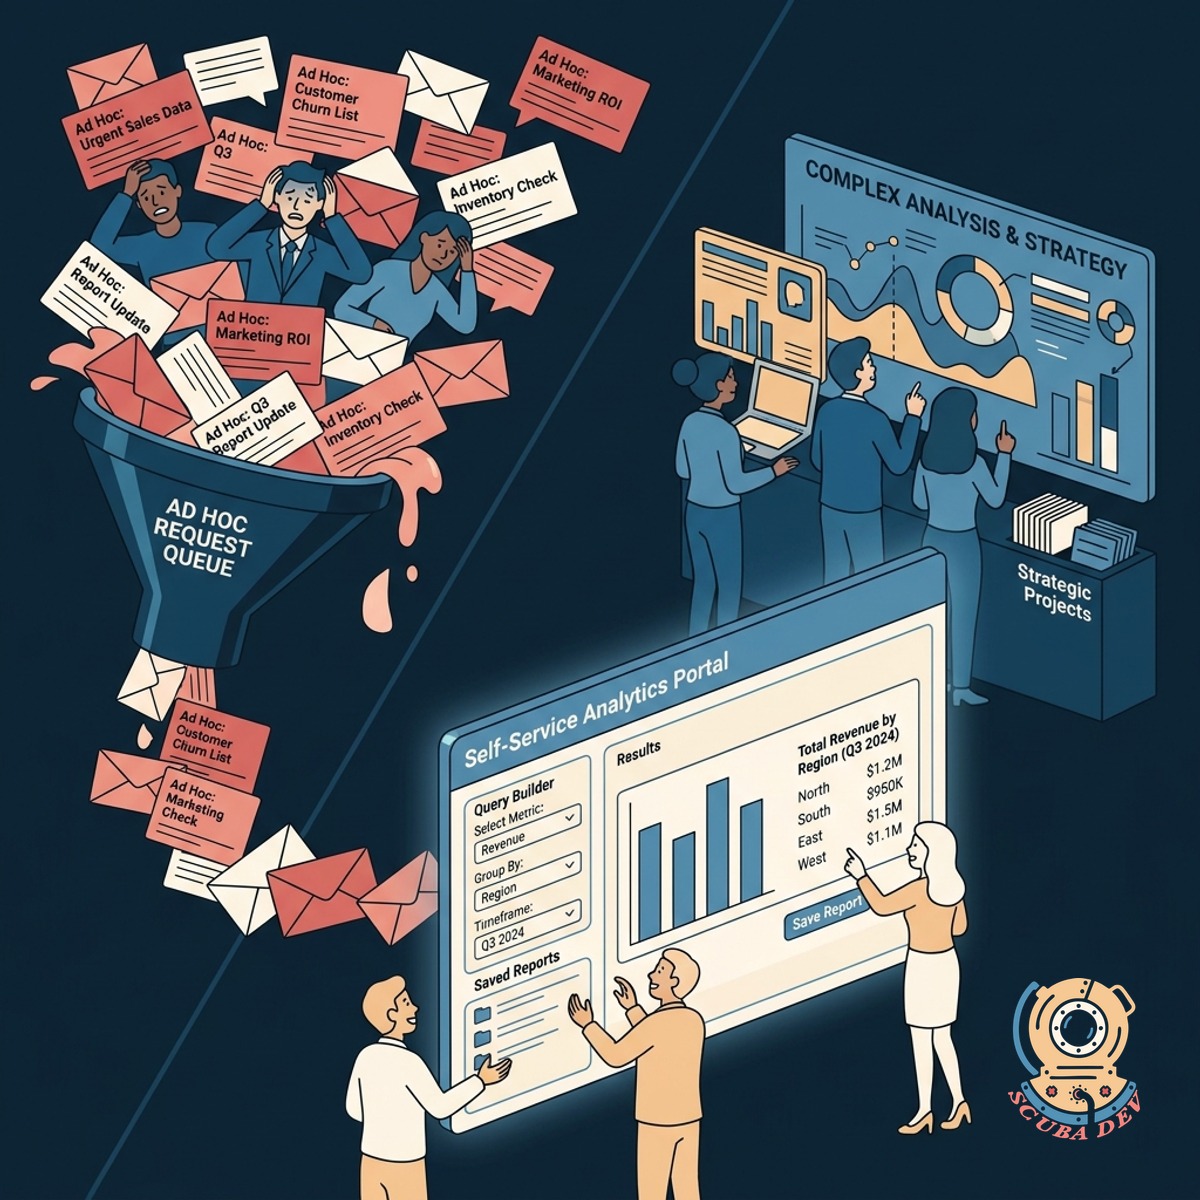
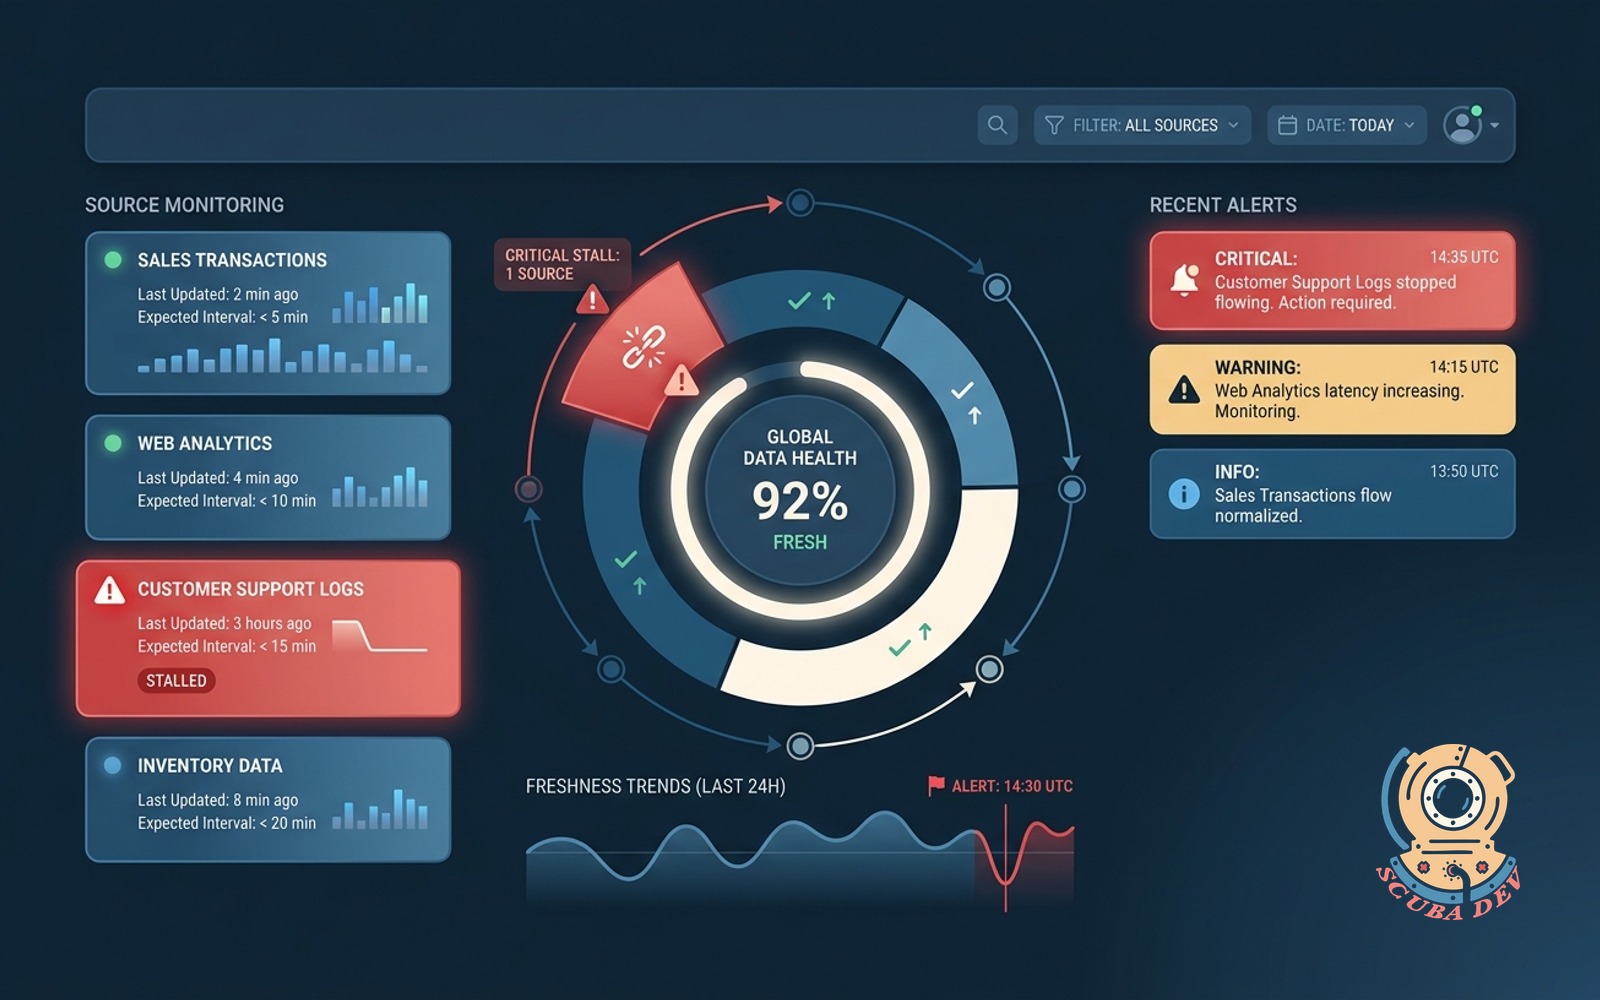
Reduce The Ad Hoc Request Queue
Free up your data team to focus on complex analysis by empowering stakeholders to answer their own routine questions.
- Answer questions instantly
- Save custom report views
- Schedule automated email deliveries
- Share links with teammates
Questions
Things people ask
What is a governed metrics layer?
A governed metrics layer is a centralized system that defines how business metrics are calculated. It ensures that when someone pulls a report for total revenue, the underlying math is exactly the same across the entire company.
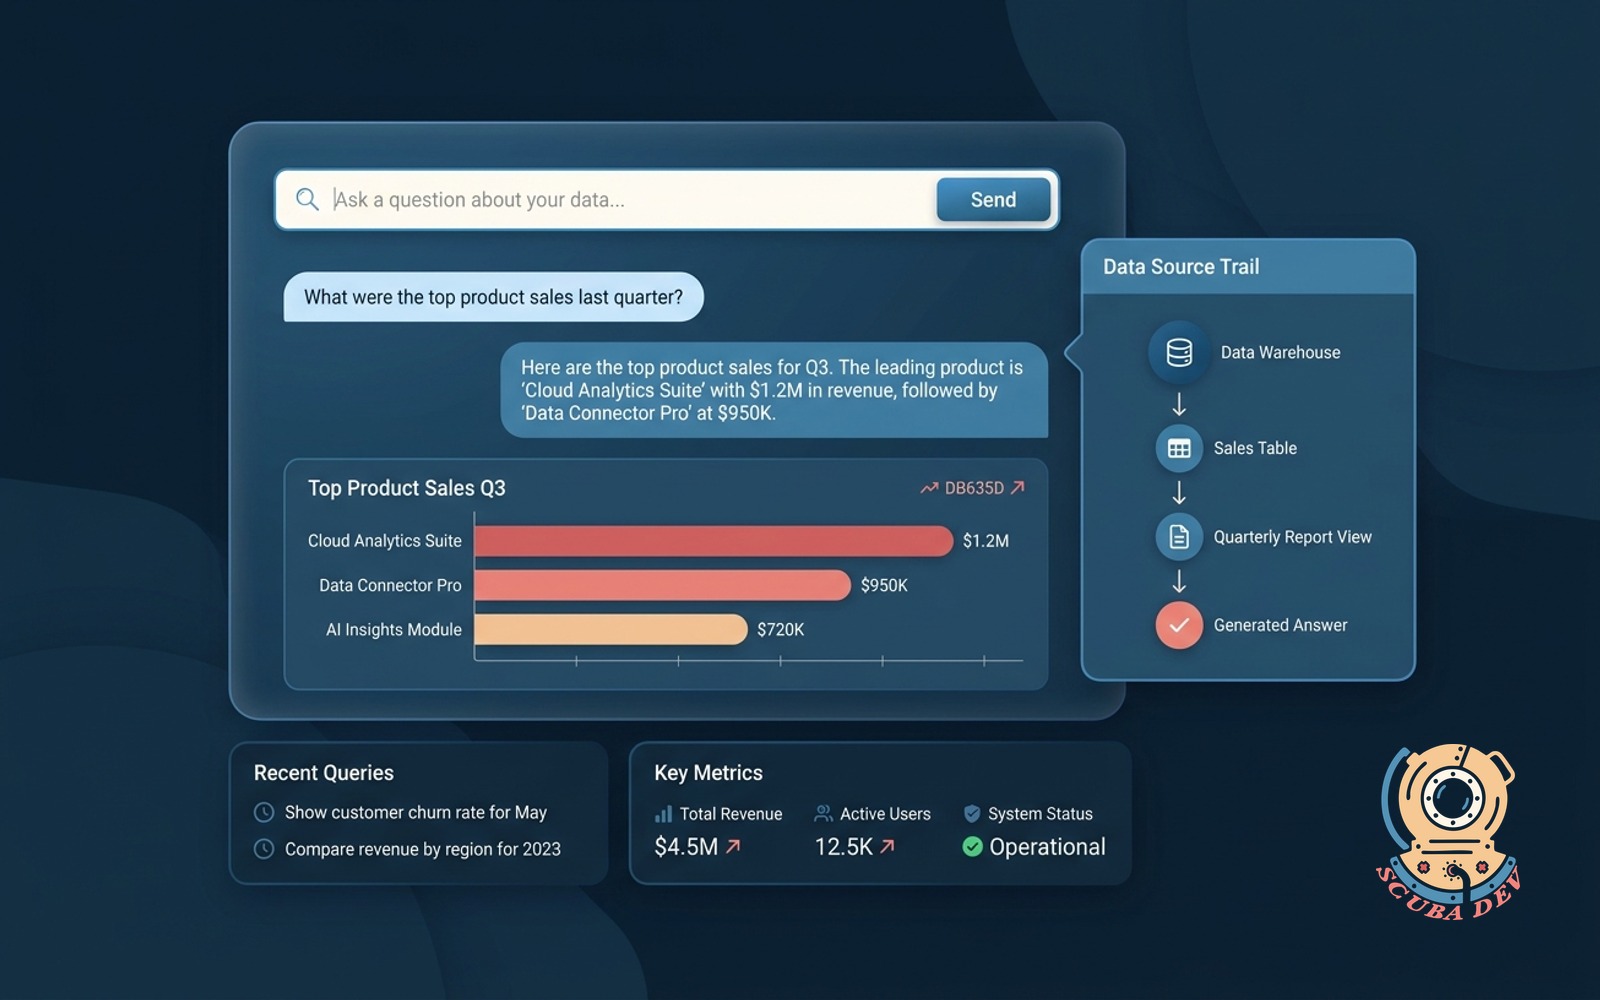
Do users need to know SQL to use this?
No. The builder uses a visual interface. Users simply select the data points they want from a menu, and the tool generates the query in the background.
Which semantic layers do you support?
We typically build on top of established semantic layers like dbt Semantic Layer or Cube. This allows us to integrate smoothly with your existing data stack.
Can users export the data they build?
Yes. Once a user builds a report, they can export the underlying data to a CSV or Excel file for further use in other applications.
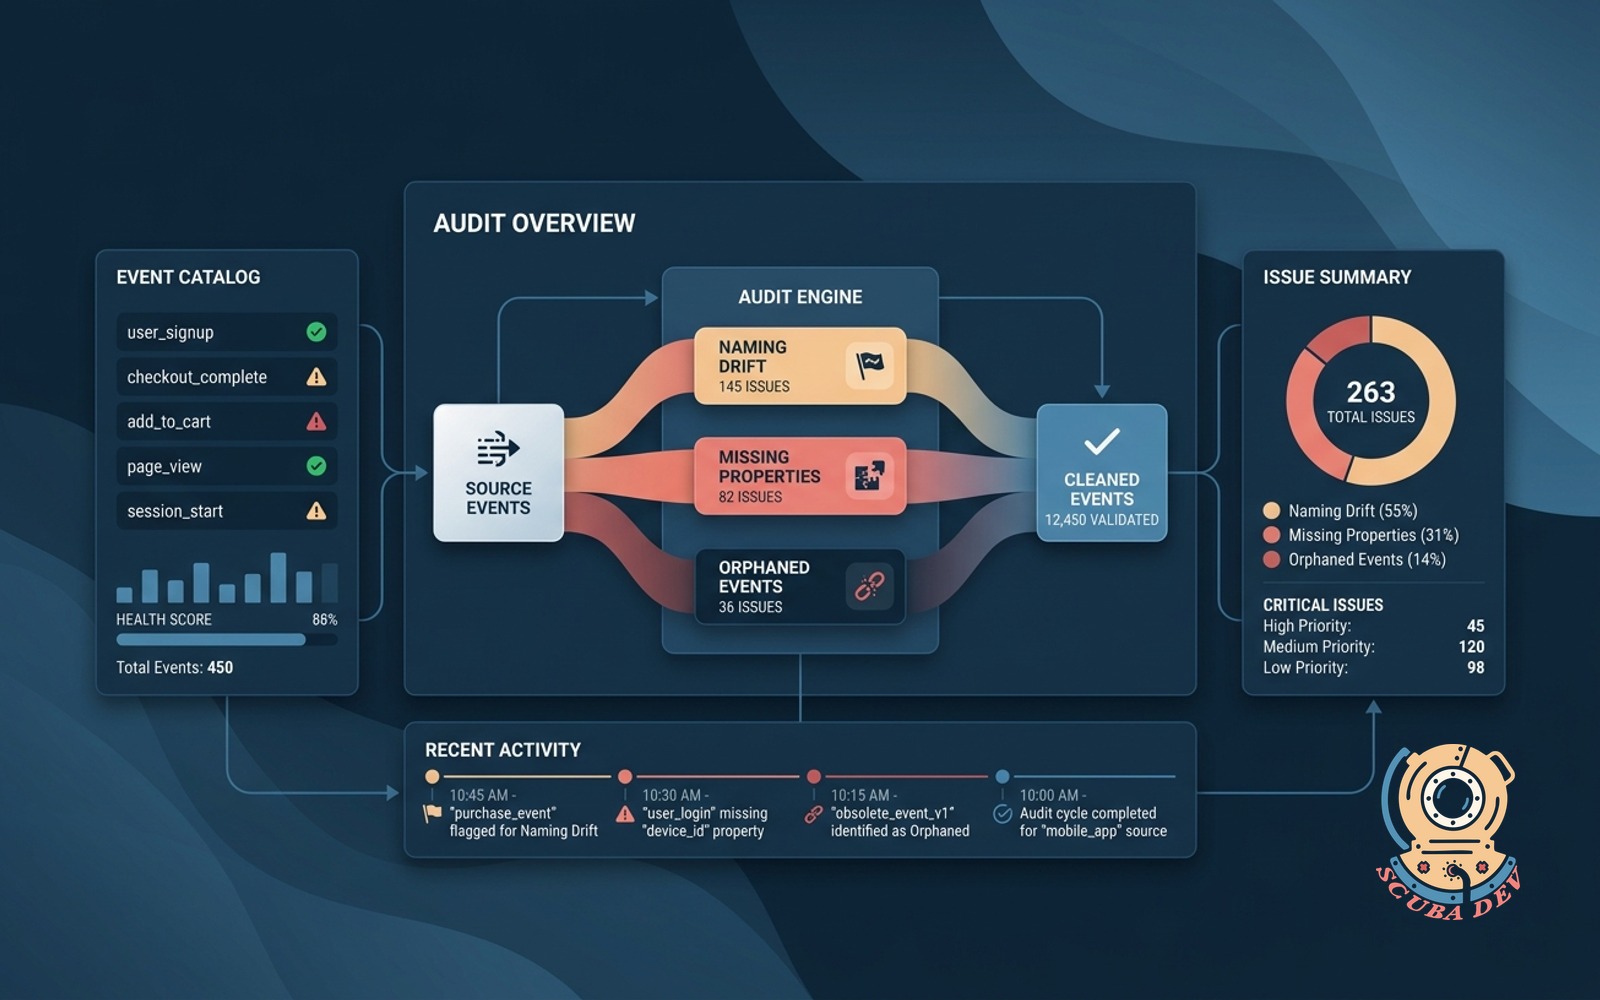
How do we prevent users from pulling bad data?
The governed metrics layer restricts users to pre approved dimensions and measures. They cannot create rogue calculations or join tables incorrectly, which maintains data accuracy.
Can reports be saved and shared?
Users can save their custom report configurations to a shared workspace. They can then send a direct link to teammates or embed the chart in a presentation.
Does this replace our existing BI tool?
It depends on your setup. This can serve as a lightweight alternative for business users who find tools like Tableau or Looker too complex, while your analysts continue using advanced BI platforms.