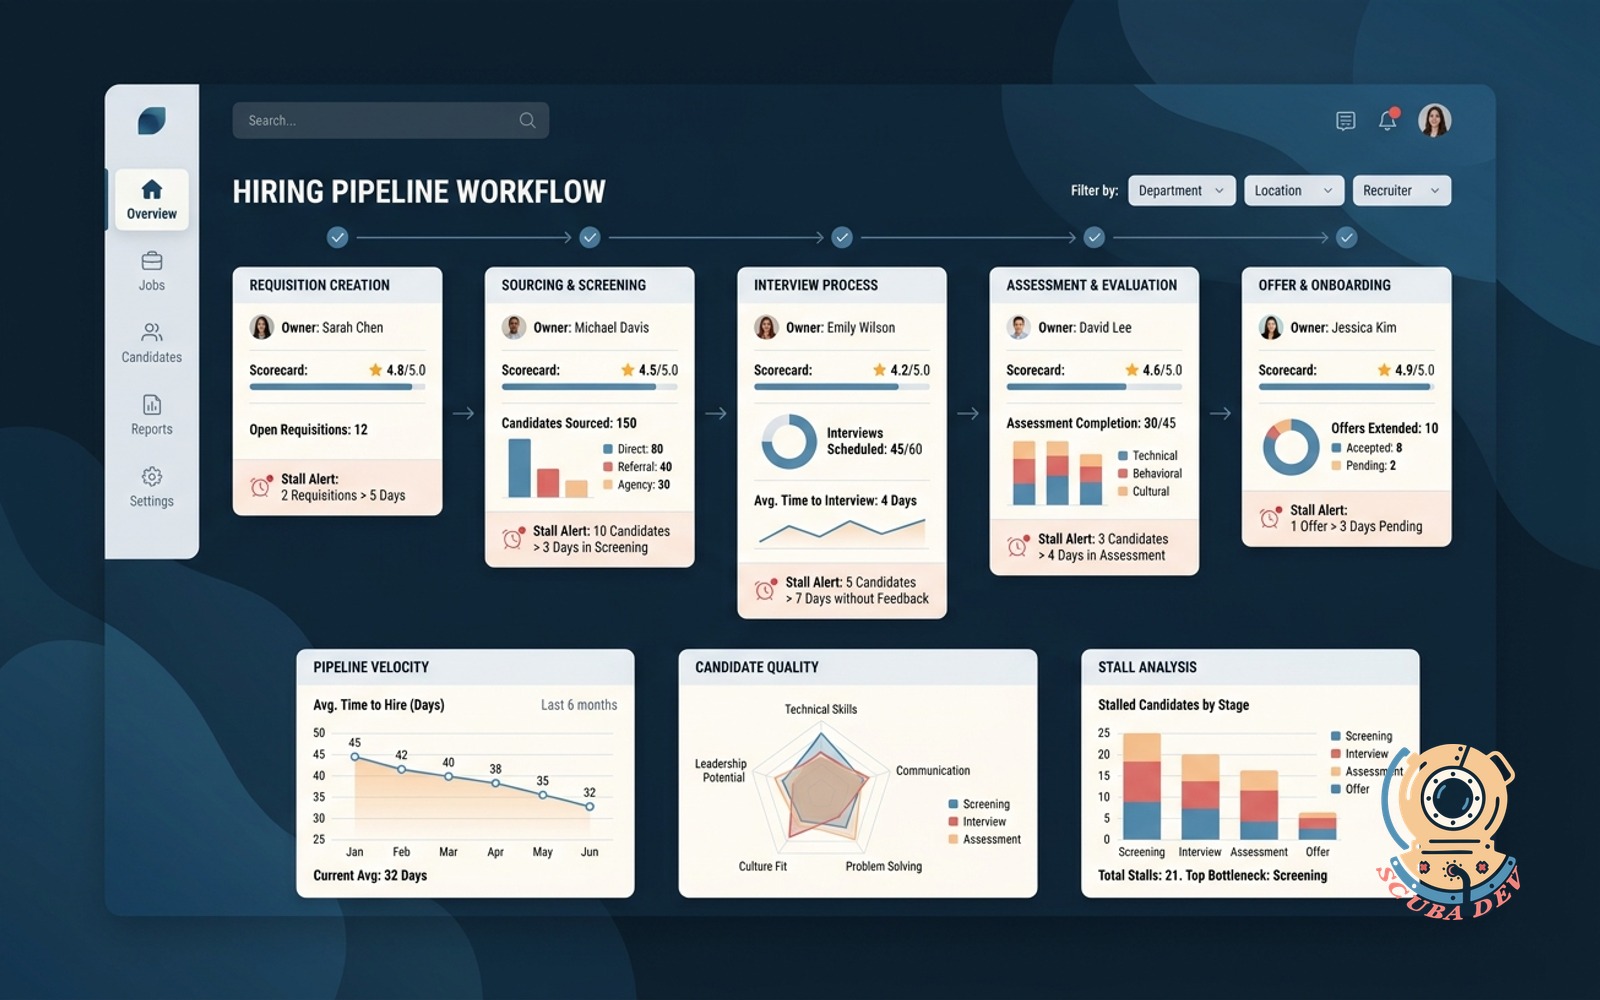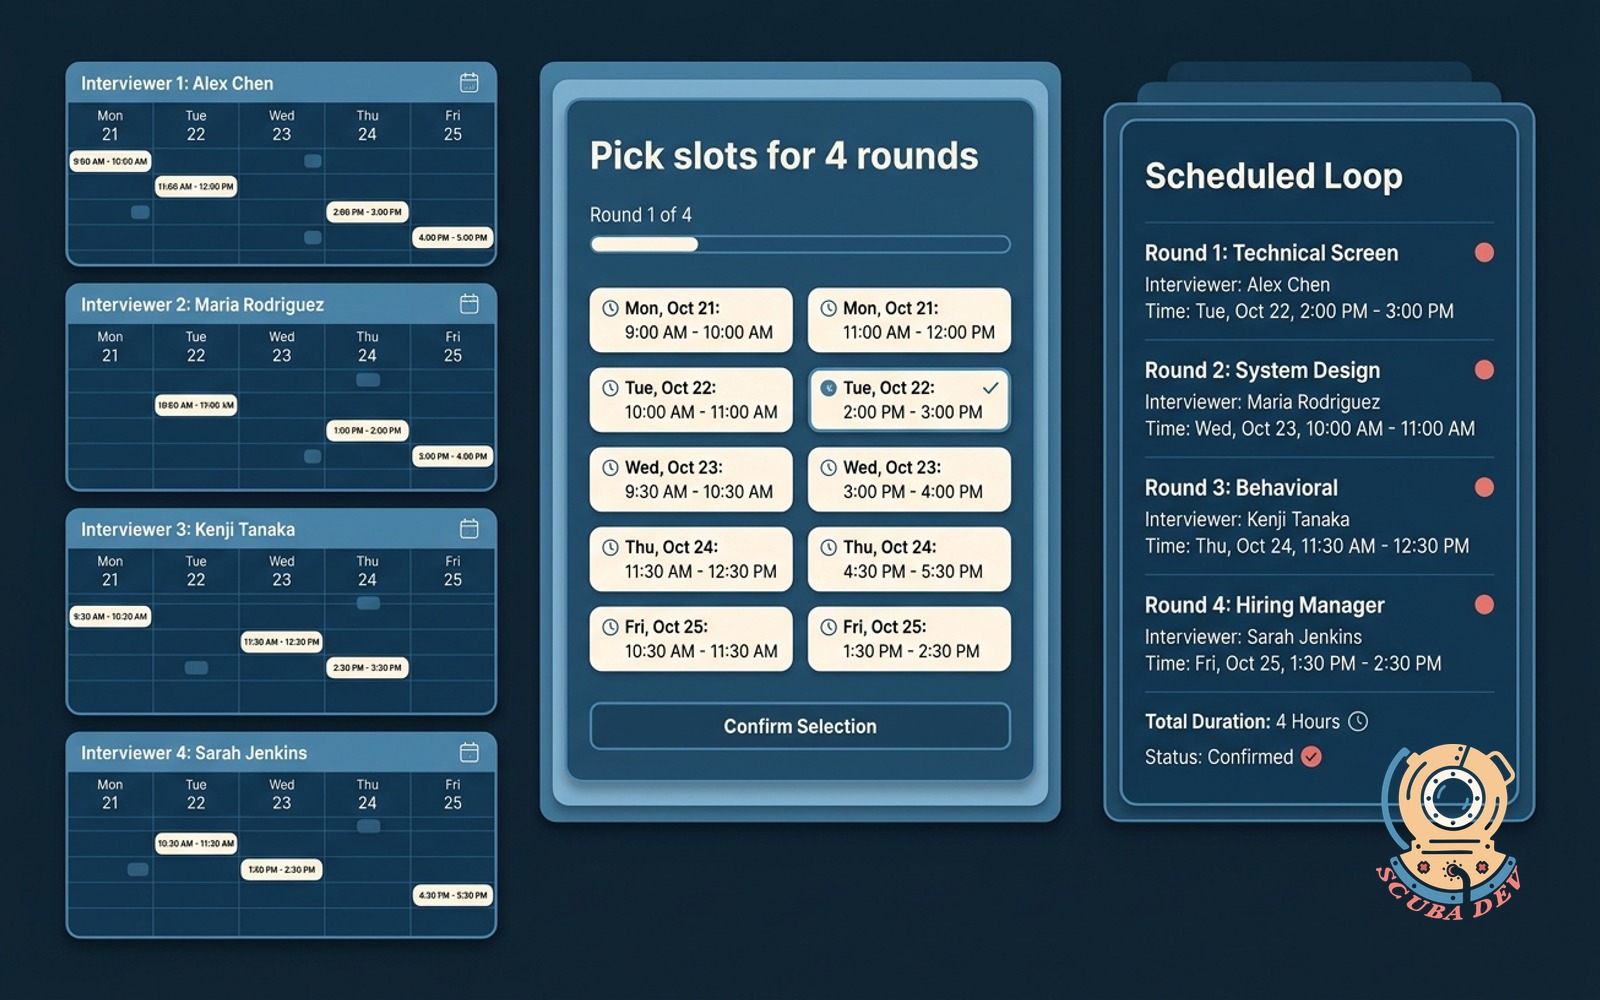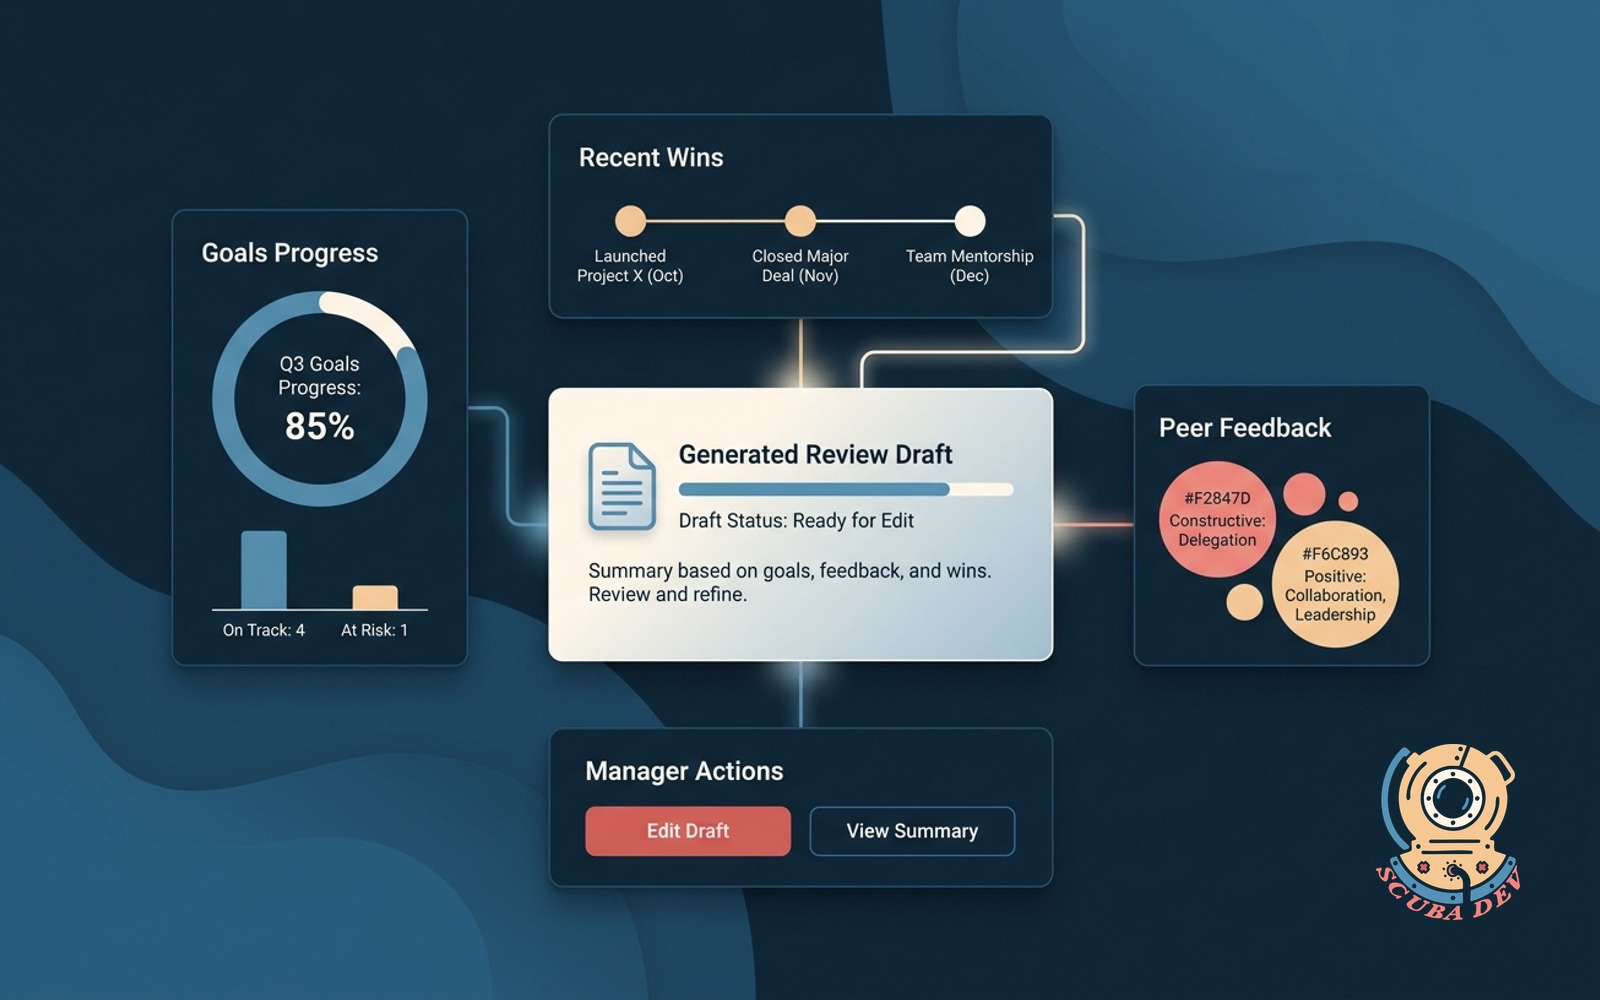

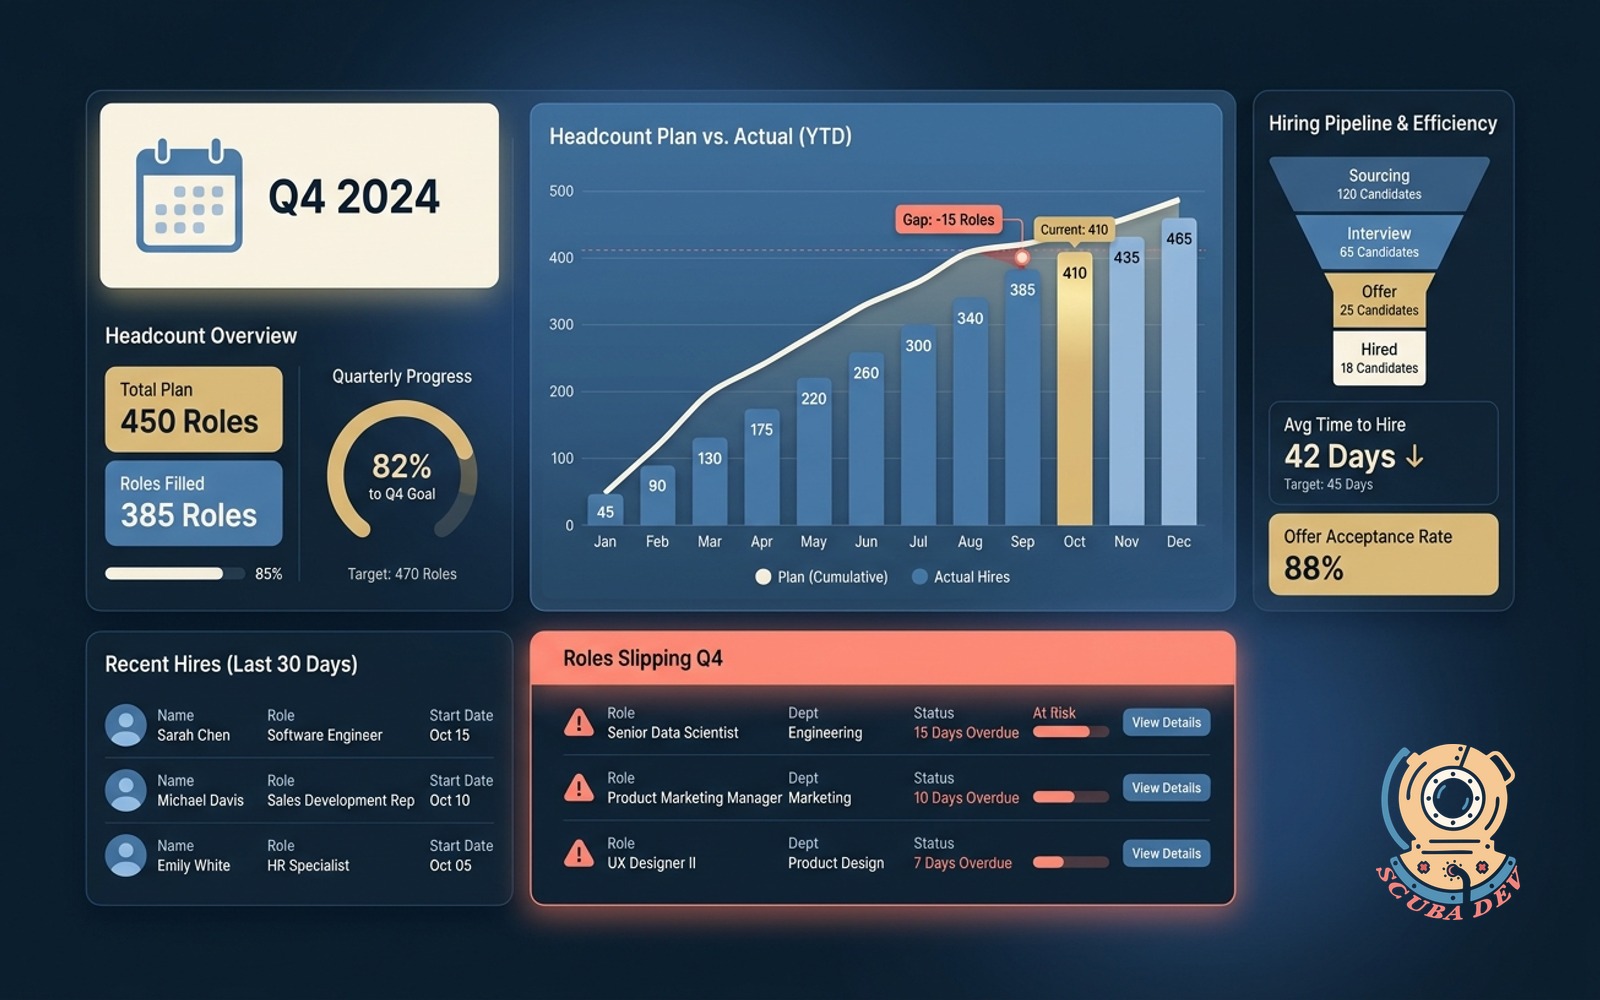
Headcount plan versus actual dashboard
Plots hiring plan against filled roles and time to hire. Flags roles slipping the quarter.
Possibilities
Where this could go
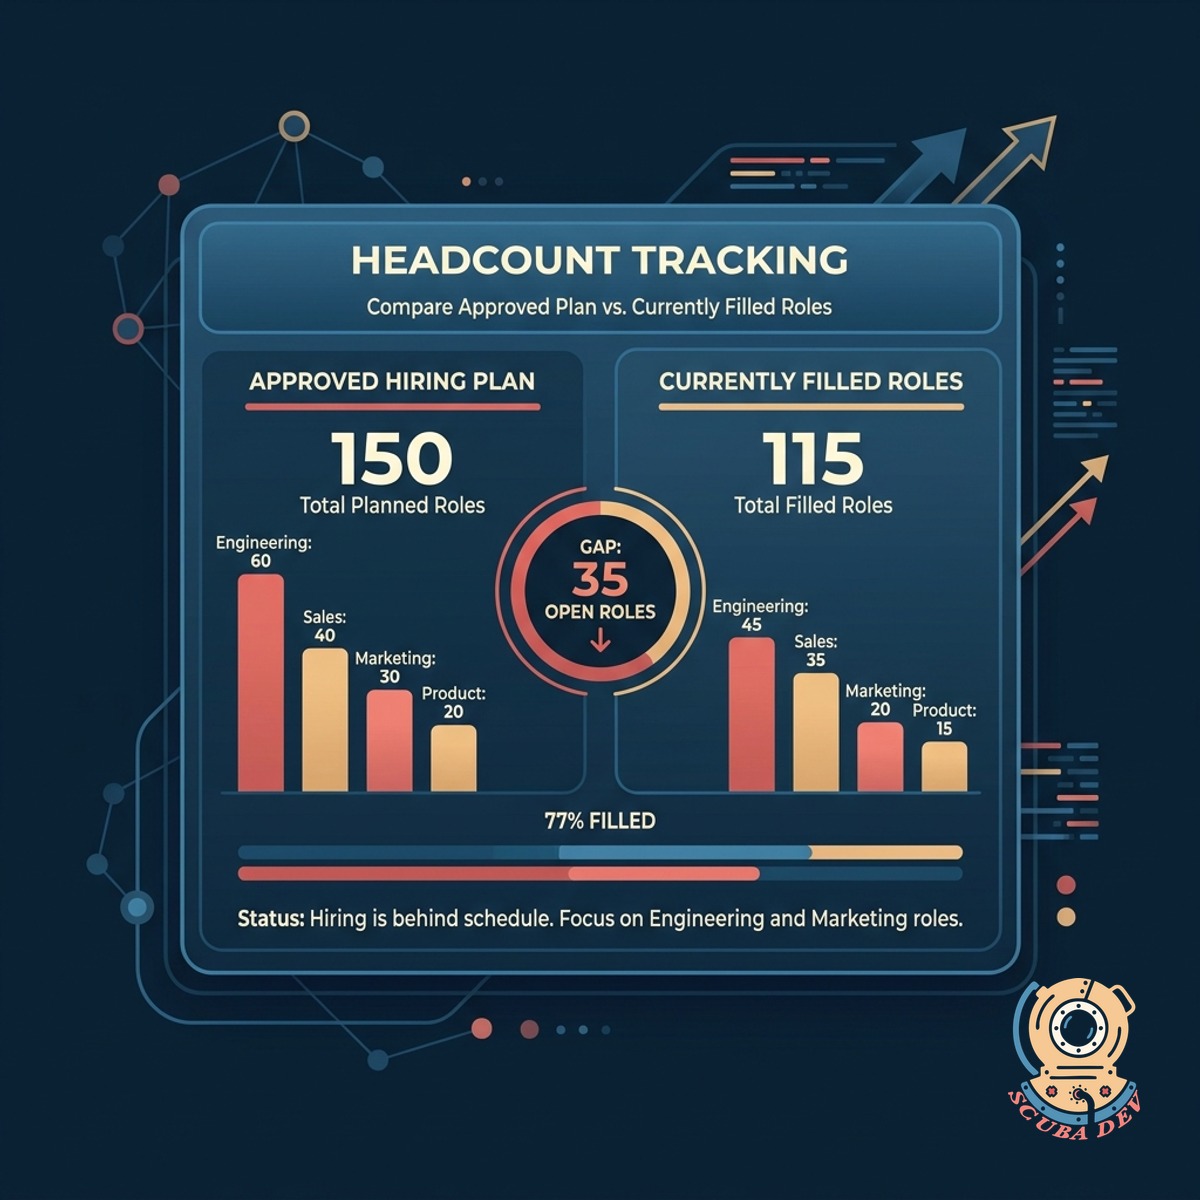
Track Planned Versus Actual Headcount
Compare your approved hiring plan against currently filled roles to see exactly where your team stands.
- Import headcount plans from Excel or Google Sheets
- Sync active employee data from Workday or BambooHR
- View discrepancies between target and actual numbers
- Filter data by department or specific hiring manager
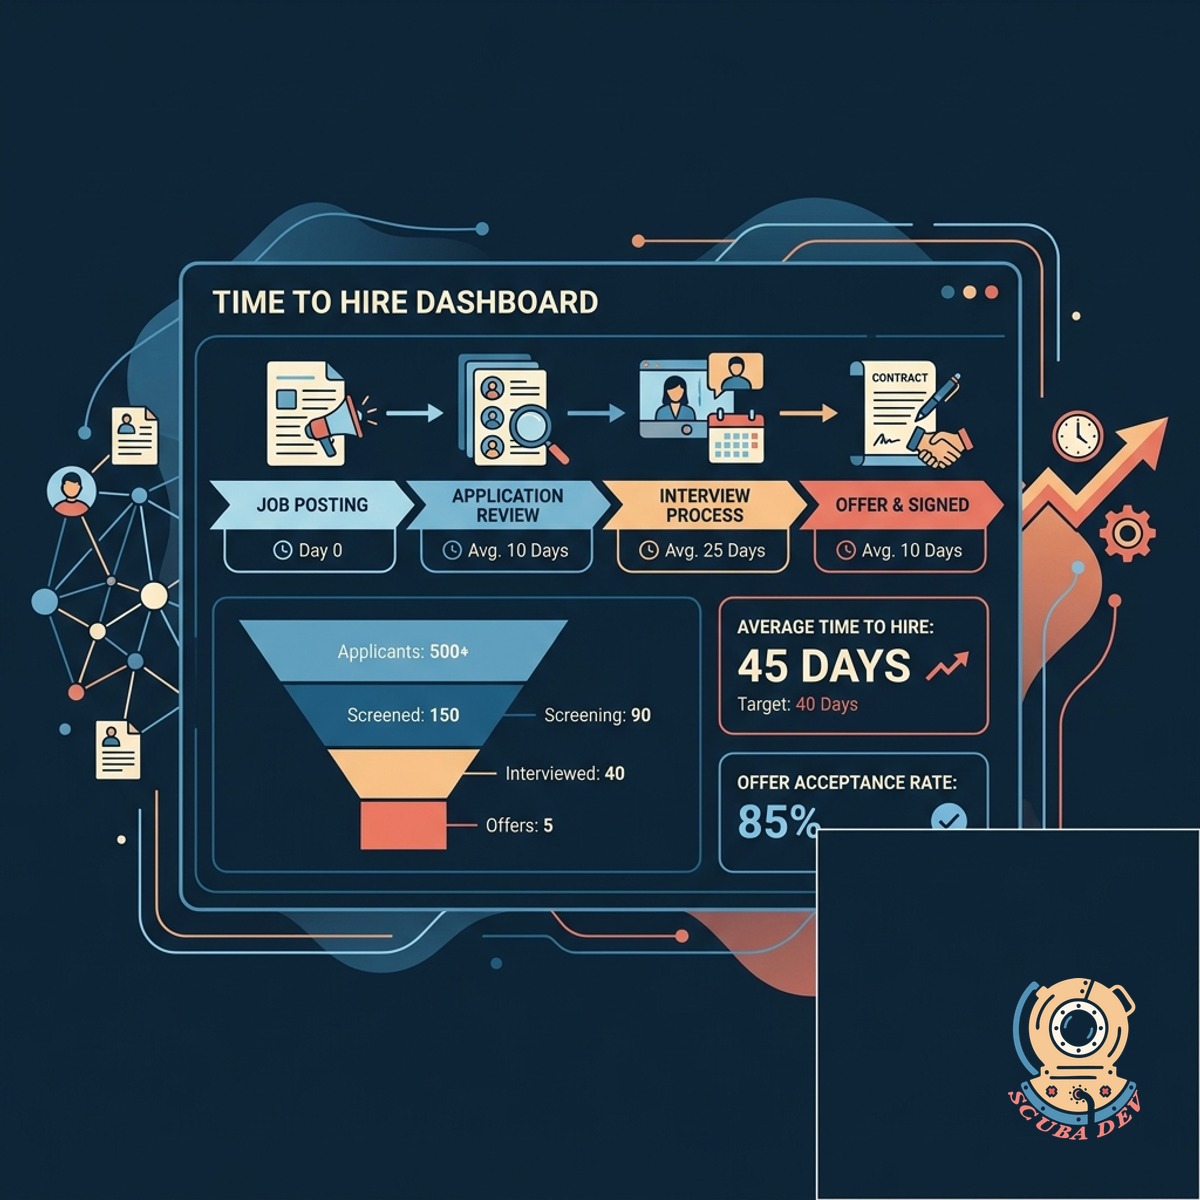
Monitor Time To Hire Metrics
Track how long it takes to fill open positions from the initial job posting to the signed offer letter.
- Pull candidate pipeline data directly from Greenhouse
- Calculate average days to hire across different departments
- Identify bottlenecks in specific interview stages
- Compare current hiring speeds against historical averages
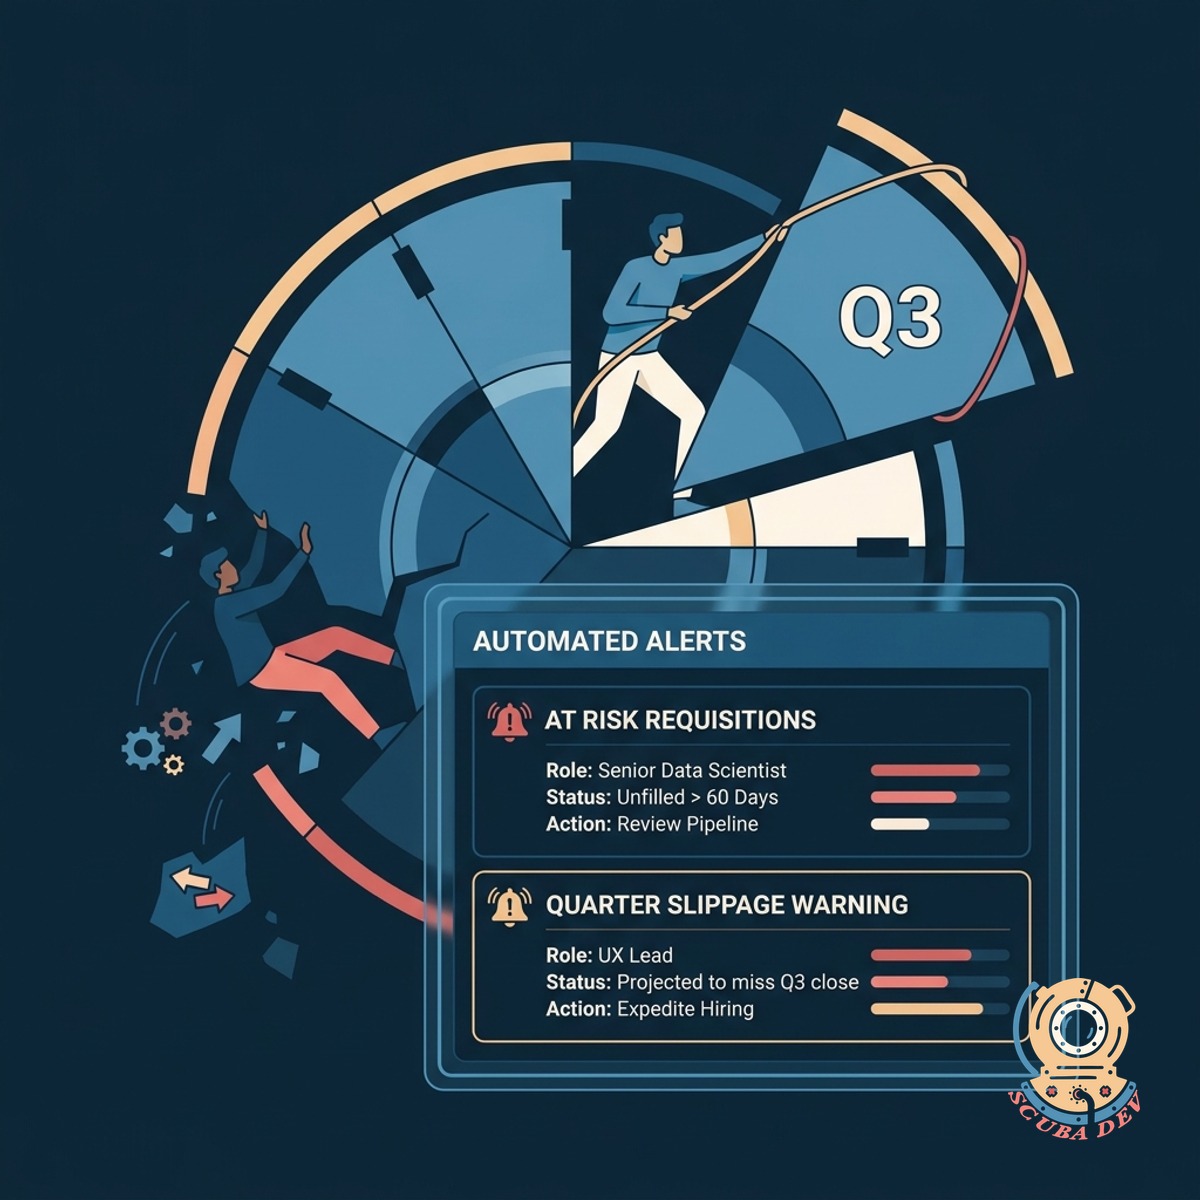
Flag Roles Slipping The Quarter
Receive automated alerts for open requisitions that are at risk of remaining unfilled past the current quarter.
- Set custom deadlines for critical role placements
- Highlight requisitions with low candidate pipeline volume
- Send automated status updates to Slack channels
- Generate weekly reports for executive leadership teams
Questions
Things people ask
Which Applicant Tracking Systems do you integrate with?
We connect with major platforms like Greenhouse, Lever, and Workable using their standard APIs. If you use a custom or niche ATS, we can build a specific integration to pull your pipeline data.
How do we input our approved headcount plan?
You can upload a CSV file or connect directly to a Google Sheet where your finance team manages the plan. The dashboard automatically updates when changes are made to the source document.
Can hiring managers see only their specific departments?
Yes. We implement role based access control so department heads only see the data relevant to their teams. Executive users can view the entire company dashboard.
How does the tool determine if a role is slipping the quarter?
The system looks at your historical time to hire for similar roles and compares it to the current pipeline stage of active candidates. If the projected offer date falls outside the quarter, the role is flagged.
Does this replace our existing HR software?
No. This dashboard sits on top of your existing tools like BambooHR and Greenhouse. It aggregates the data into a single view specifically for headcount tracking.
Can we export the dashboard reports for board meetings?
You can export any view as a PDF or download the underlying data as a CSV file. You can also schedule automated weekly emails containing a snapshot of the current dashboard.
How often does the actual headcount data refresh?
The dashboard syncs with your HRIS and ATS platforms on a daily basis by default. We can configure more frequent syncs if your hiring volume requires real time updates.