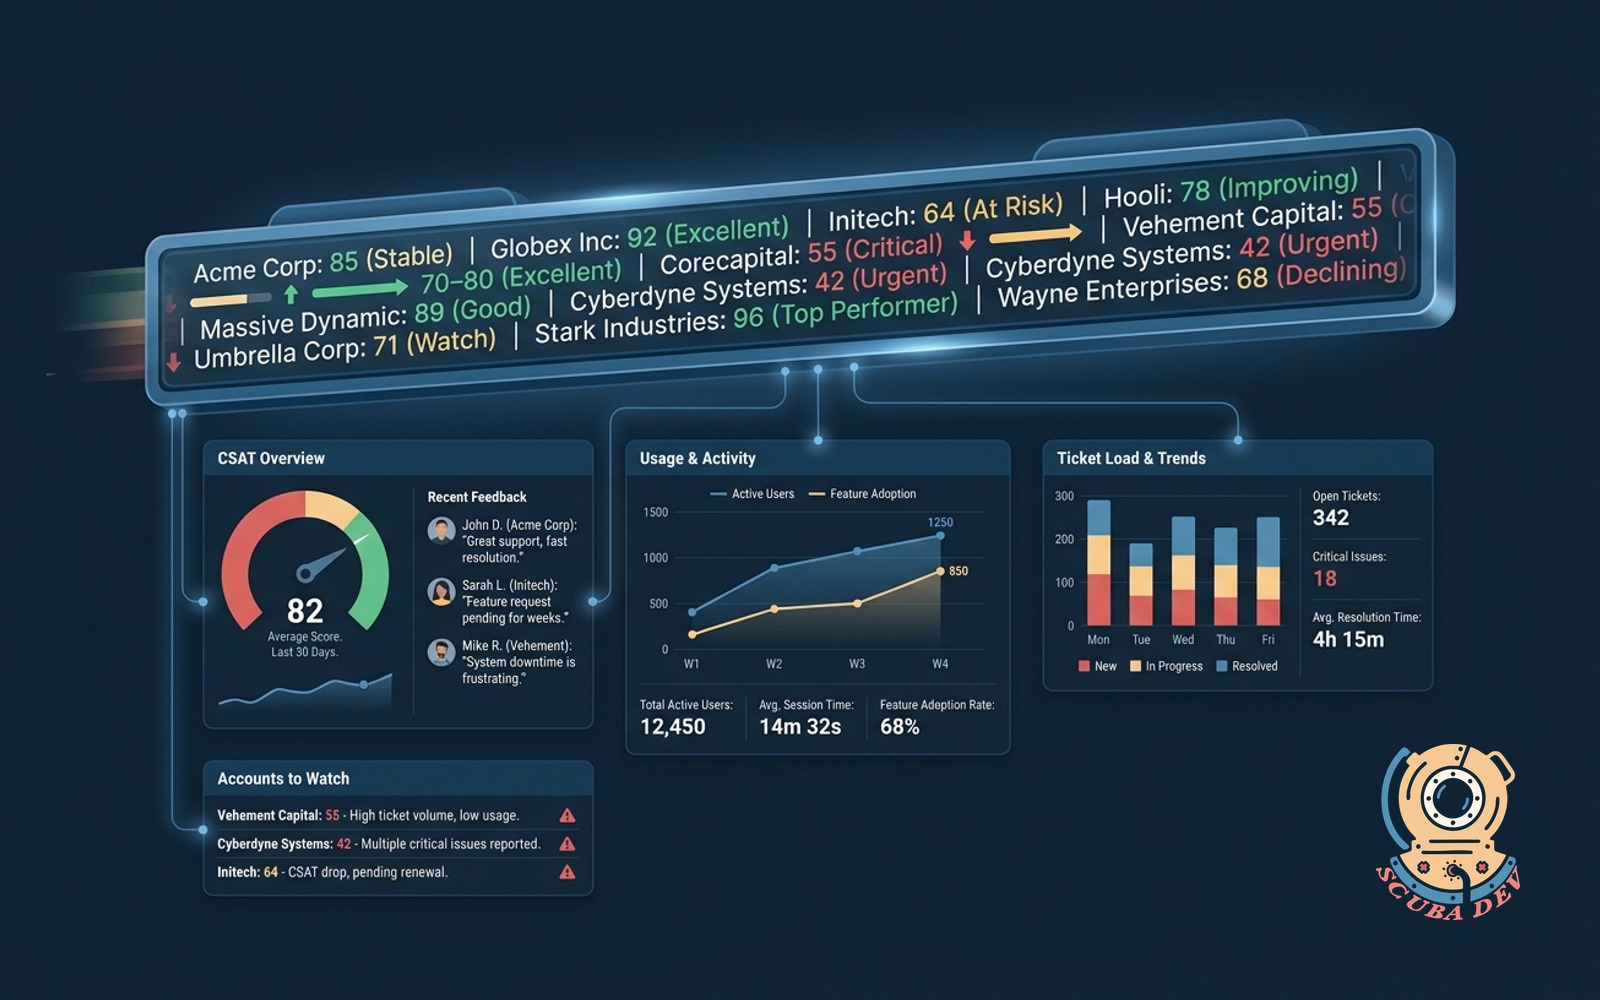
Customer health ticker
Per-account score from CSAT, usage, and ticket load. Ticker on the wall so the team sees who needs attention.
Possibilities
Where this could go
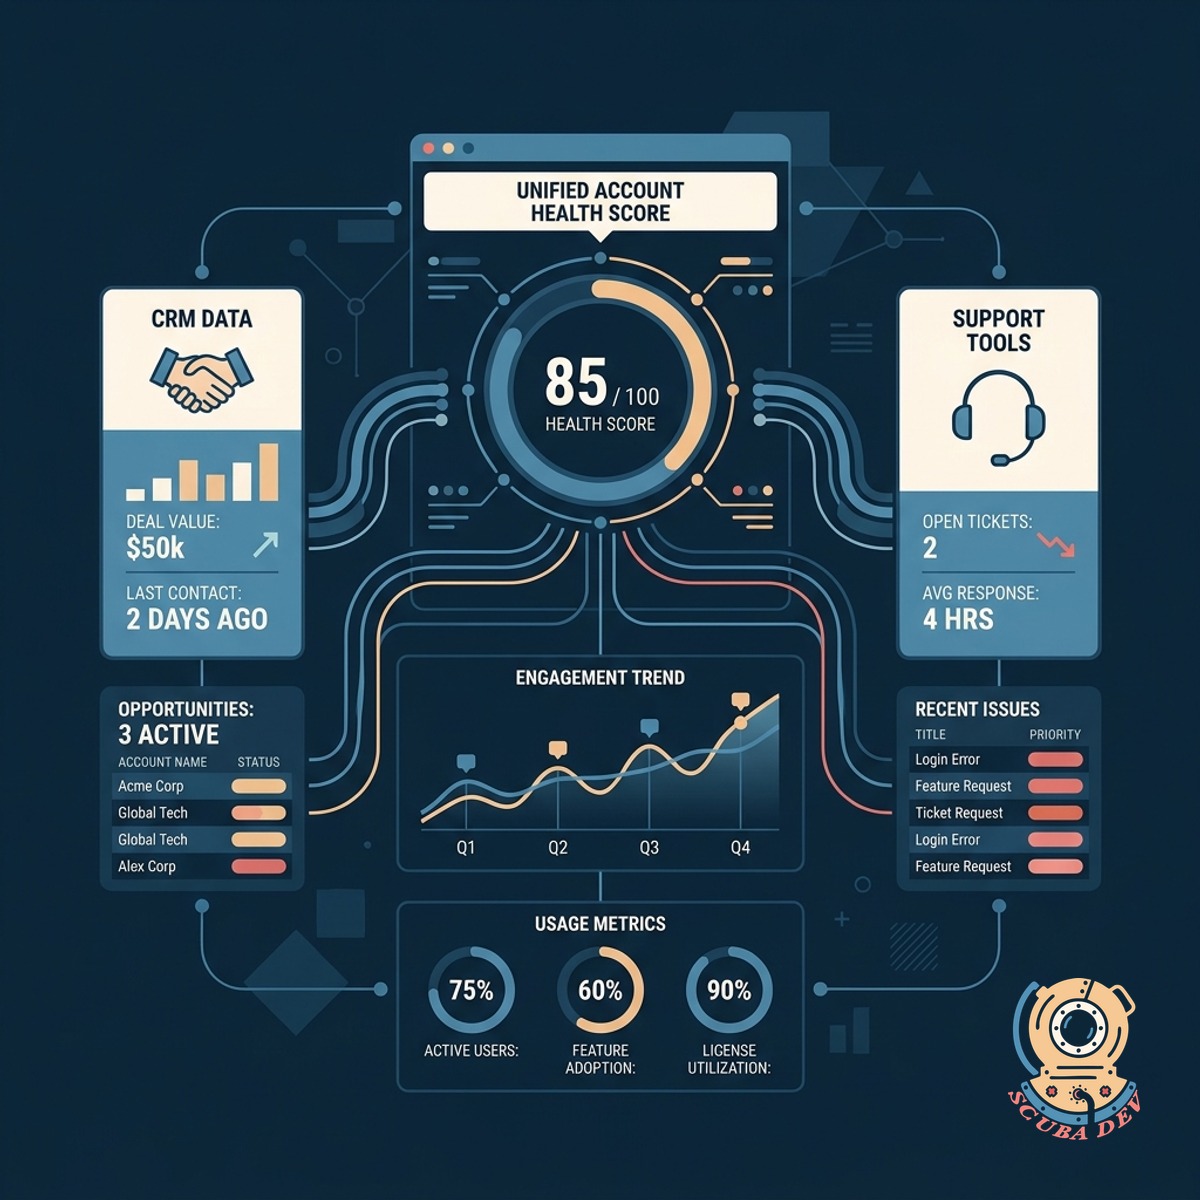
Aggregate Metrics Across Your Stack
Pull live data from your CRM and support tools to calculate a unified health score for every account.
- Connects to Zendesk and Salesforce
- Ingests Mixpanel usage data
- Calculates scores automatically
- Updates in real time
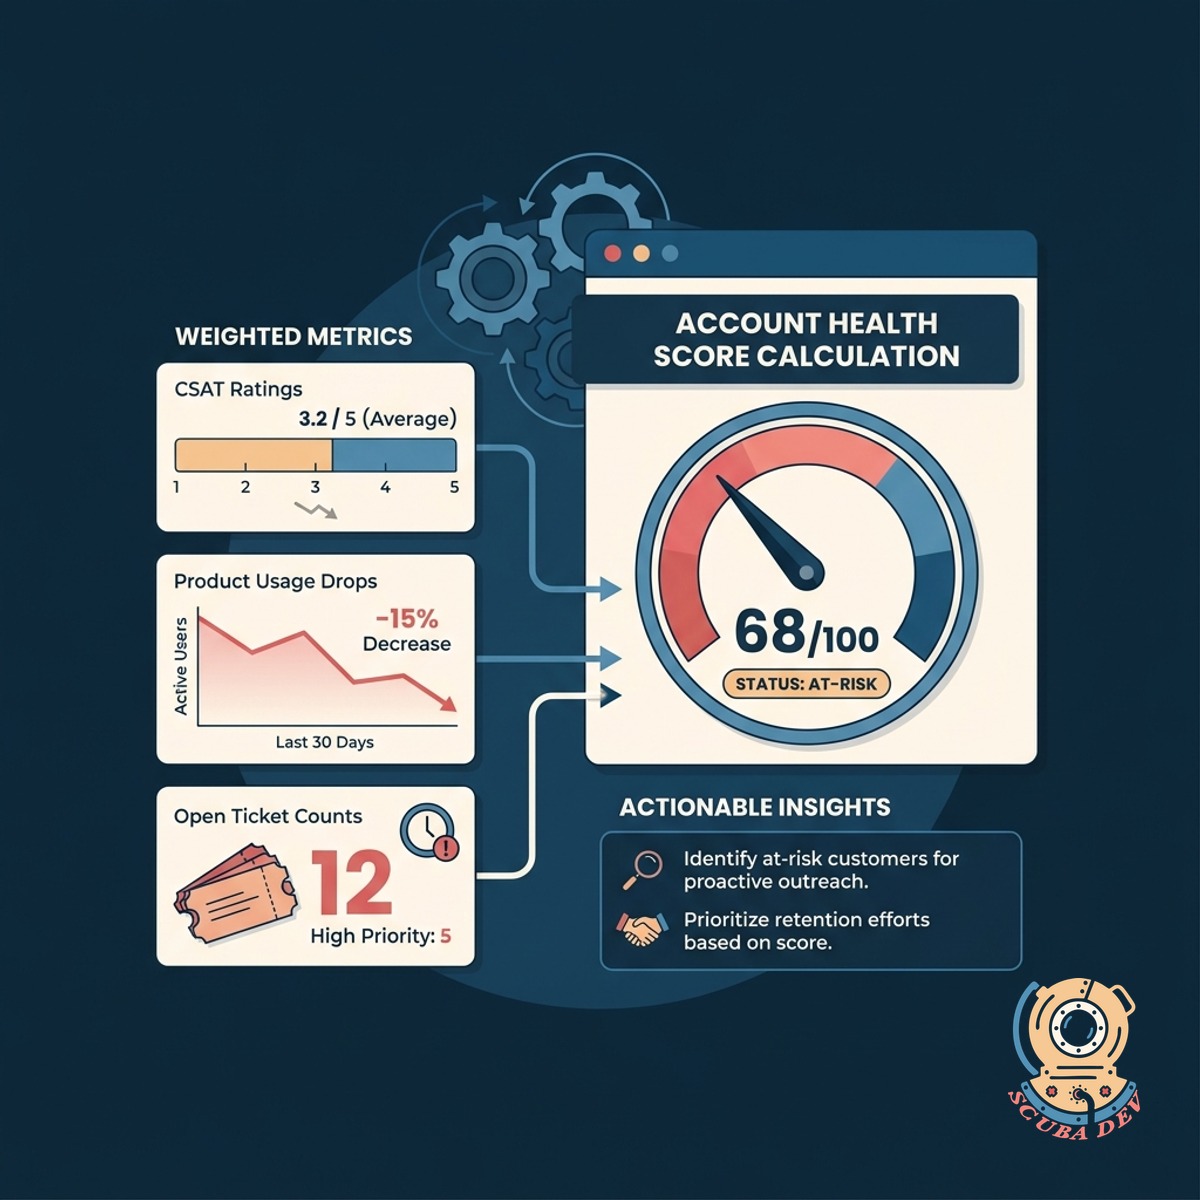
Calculate Account Health Scores Automatically
Weigh CSAT ratings against product usage drops and open ticket counts to identify at-risk customers.
- Factors in recent CSAT surveys
- Tracks daily active user trends
- Monitors open support tickets
- Flags accounts needing attention
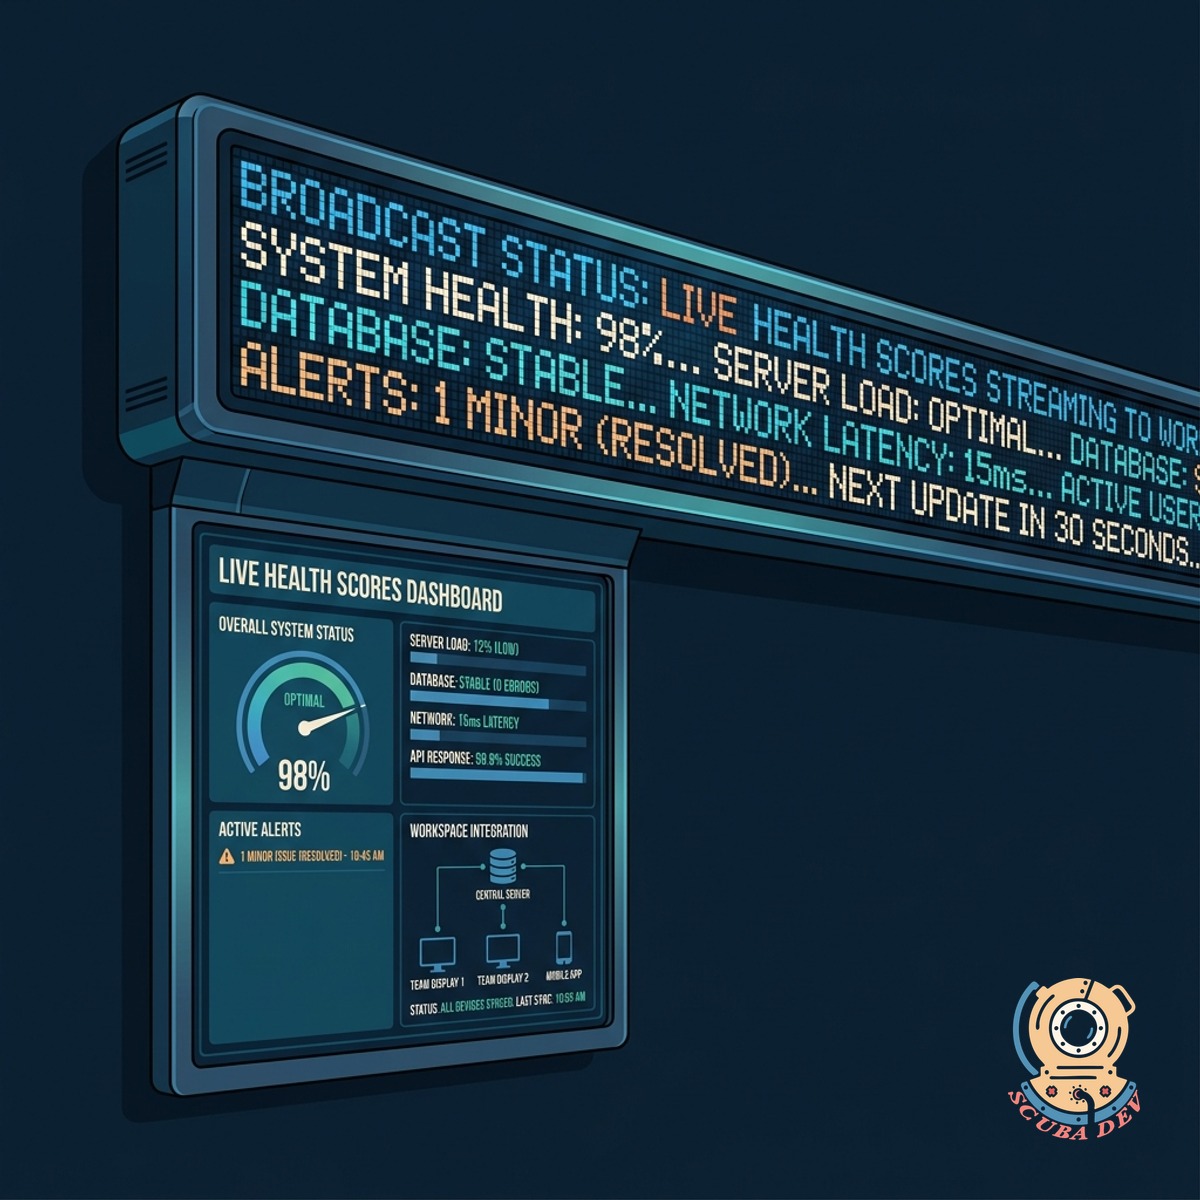
Broadcast Status On A Wall Ticker
Stream the live health scores to a physical LED display in your workspace to keep the team informed.
- Drives physical LED matrix displays
- Runs on lightweight local hardware
- Highlights critical accounts in red
- Keeps customer success teams aligned
Questions
Things people ask
Which data sources can we connect to the scoring engine?
We build integrations for your existing stack. Common sources include Zendesk for tickets, Salesforce for account details, and Mixpanel or Amplitude for product usage.
How is the customer health score calculated?
The system uses a weighted formula based on your specific priorities. It combines quantitative data like login frequency with qualitative metrics like recent CSAT scores to generate a single number.
What hardware is required for the physical ticker?
The display runs on a standard commercial LED matrix panel connected to a small computer like a Raspberry Pi. We provide the specifications and software to drive the hardware over your local network.
Can we display this data on office TVs instead of a scrolling ticker?
Yes. The system includes a web dashboard formatted for large screens. You can cast this dashboard to any smart TV or monitor in your office.
How often does the ticker update?
The scoring engine polls your connected APIs every few minutes. The physical display updates immediately whenever an account score changes.
Can we set alerts for specific score thresholds?
The software can trigger notifications when an account drops below a healthy score. These alerts can be routed to Slack channels or directly to the assigned account manager.
Is it possible to exclude certain accounts from the display?
You can configure filters to hide specific tiers or individual clients. This ensures your team only sees the accounts relevant to their daily operations.