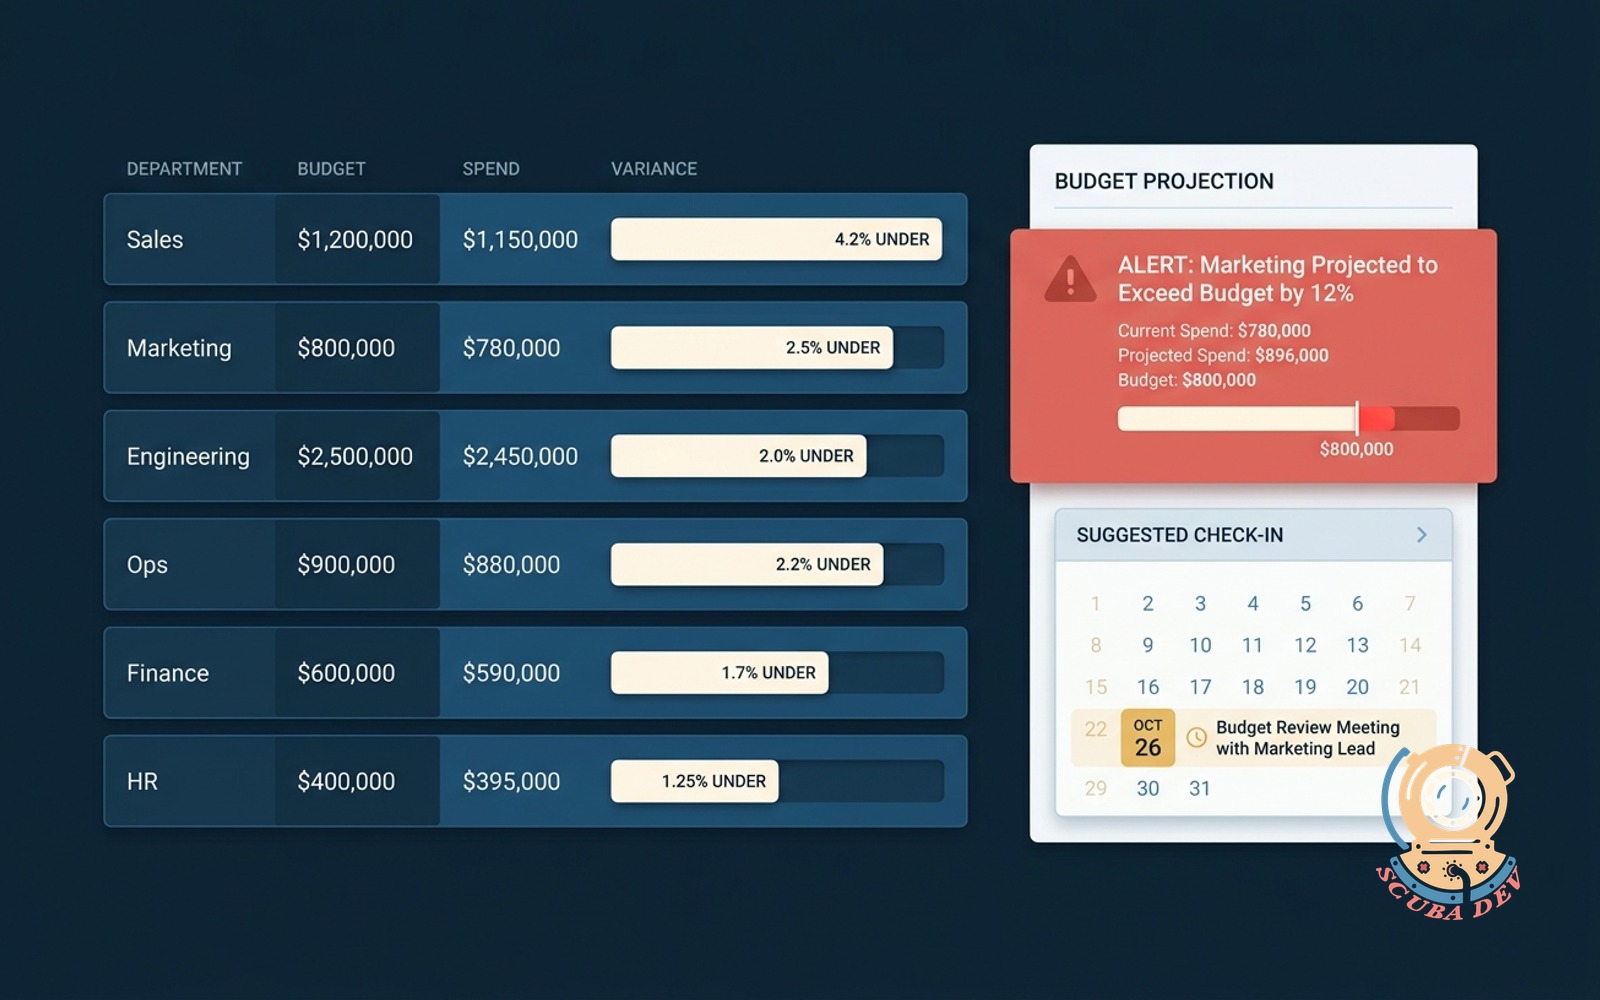
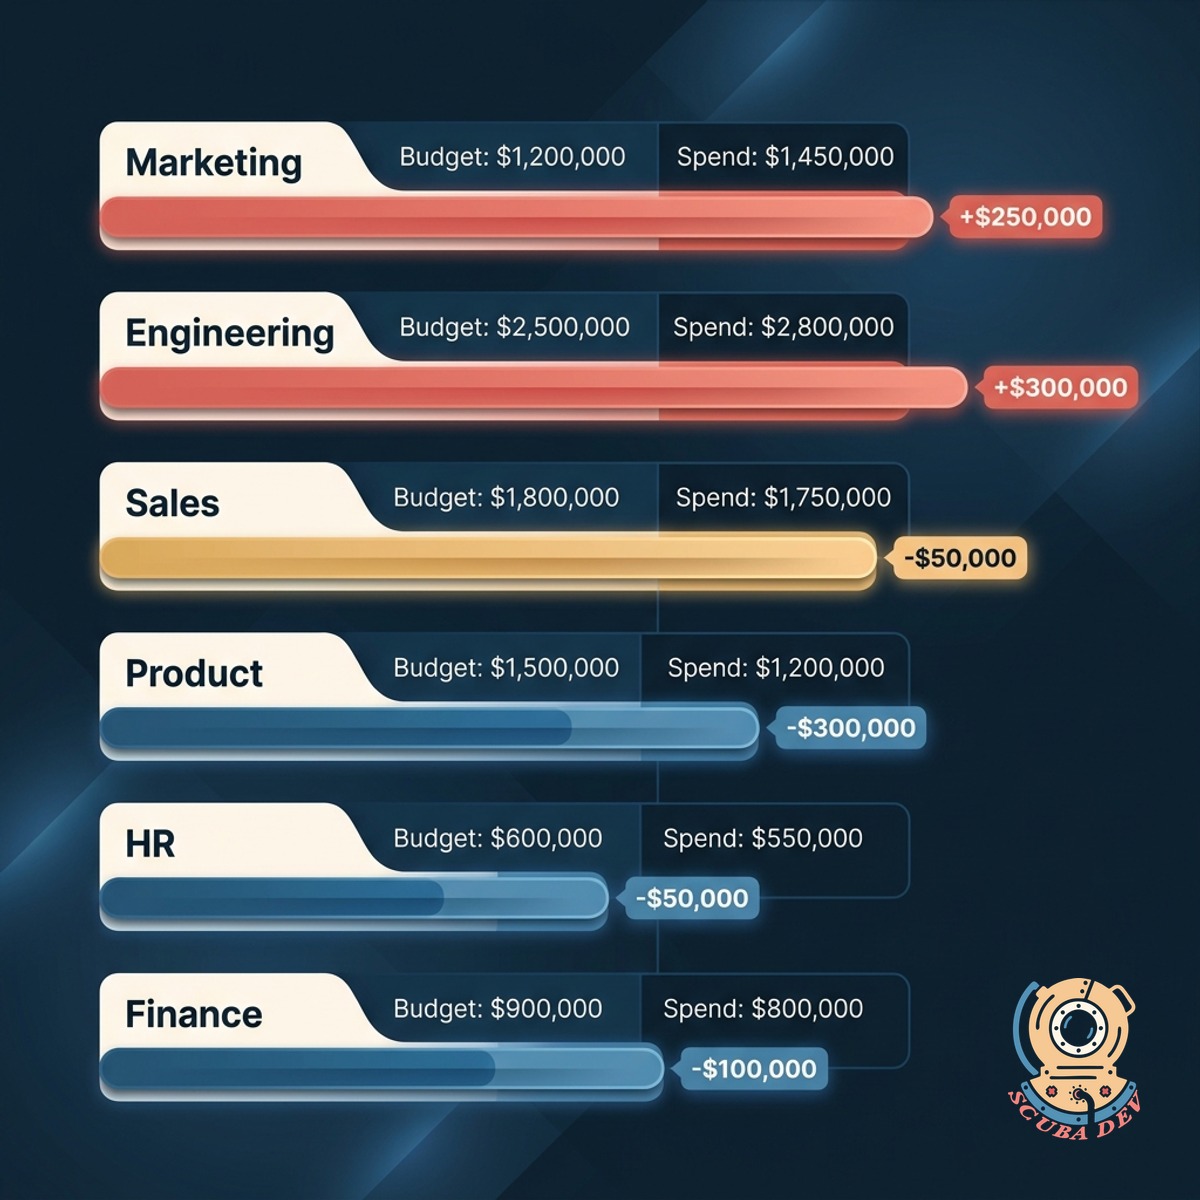
Budget vs actual dashboard by department
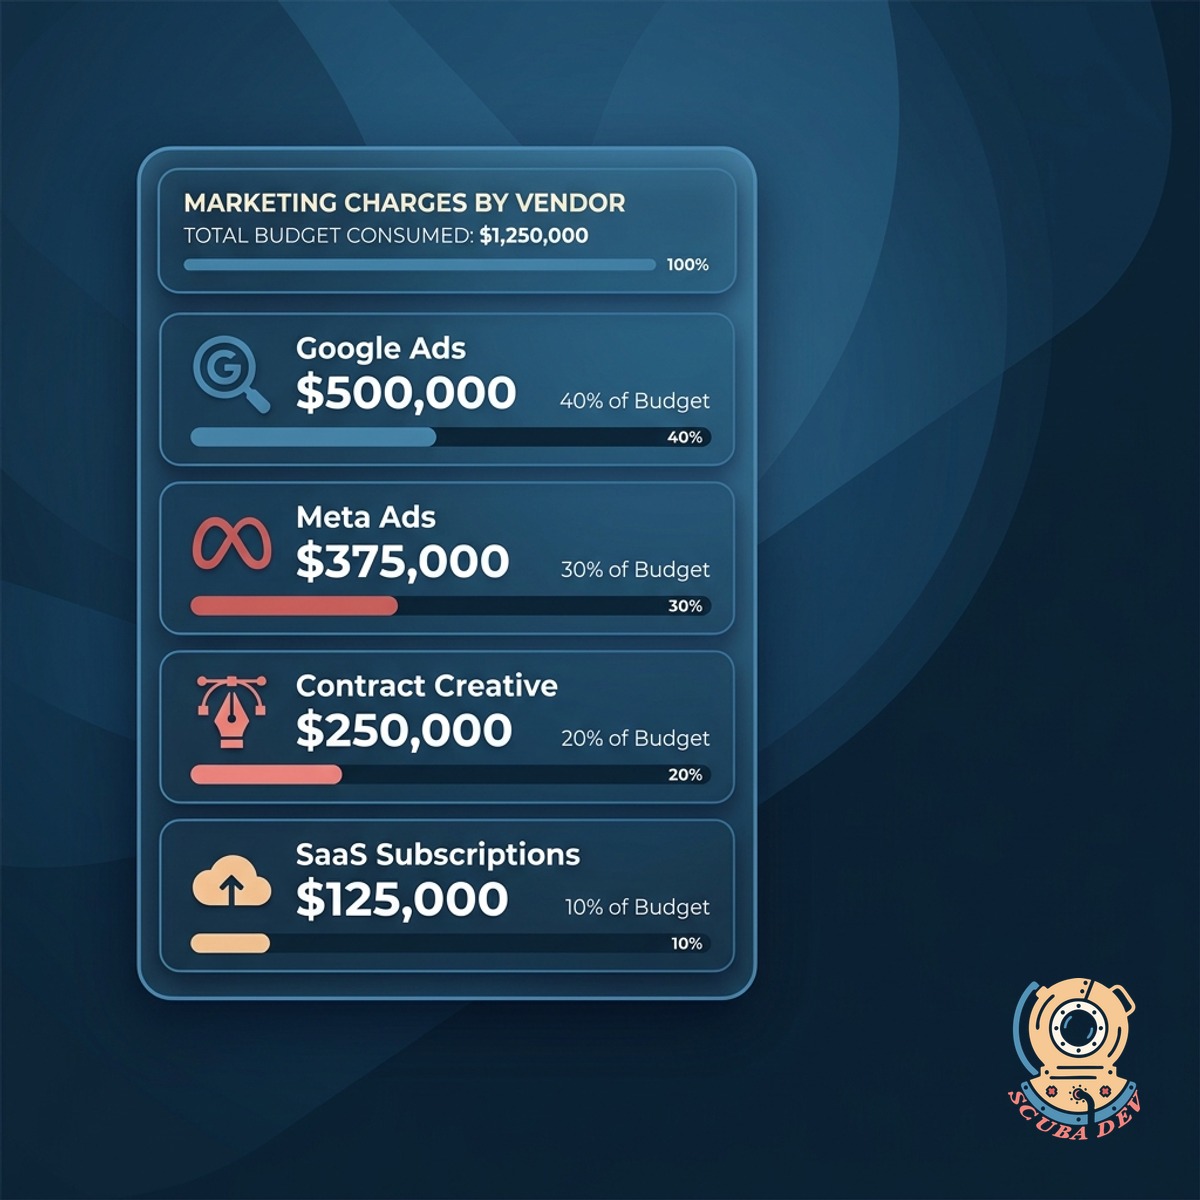
Pulls GL against budget with drill-down to the charge. Highlights departments trending over before quarter-end.
Possibilities
Where this could go
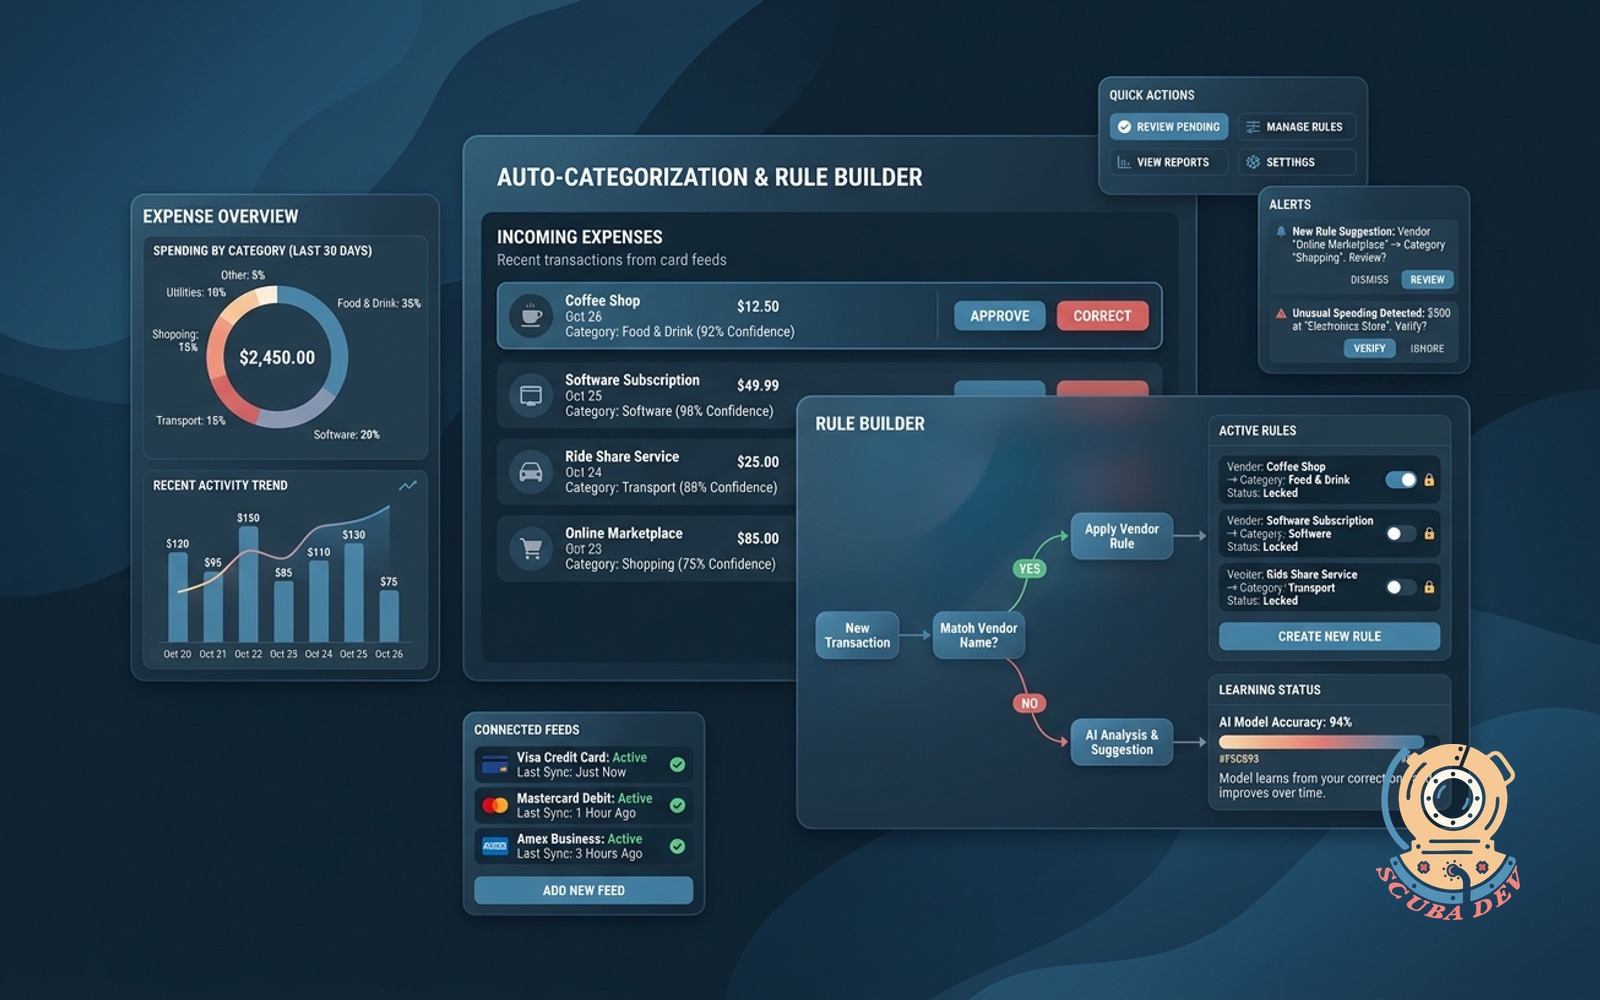
Actuals From Your GL
Pulls actual spend straight from your general ledger, mapped to your chart of accounts and department codes.
- Integrates with QuickBooks, Xero, NetSuite, Sage Intacct
- Maps to your department and cost center codes
- Refreshes nightly with manual pull on demand
Variance, Not Just Totals
Every row shows spend, budget, variance, and the trajectory. You see who is over, by how much, and how fast.
- Horizontal variance bar coral for over, cream for on, gold for approaching
- Pace indicator shows run-rate vs quarter-end target
- Drill into any row for the underlying charges
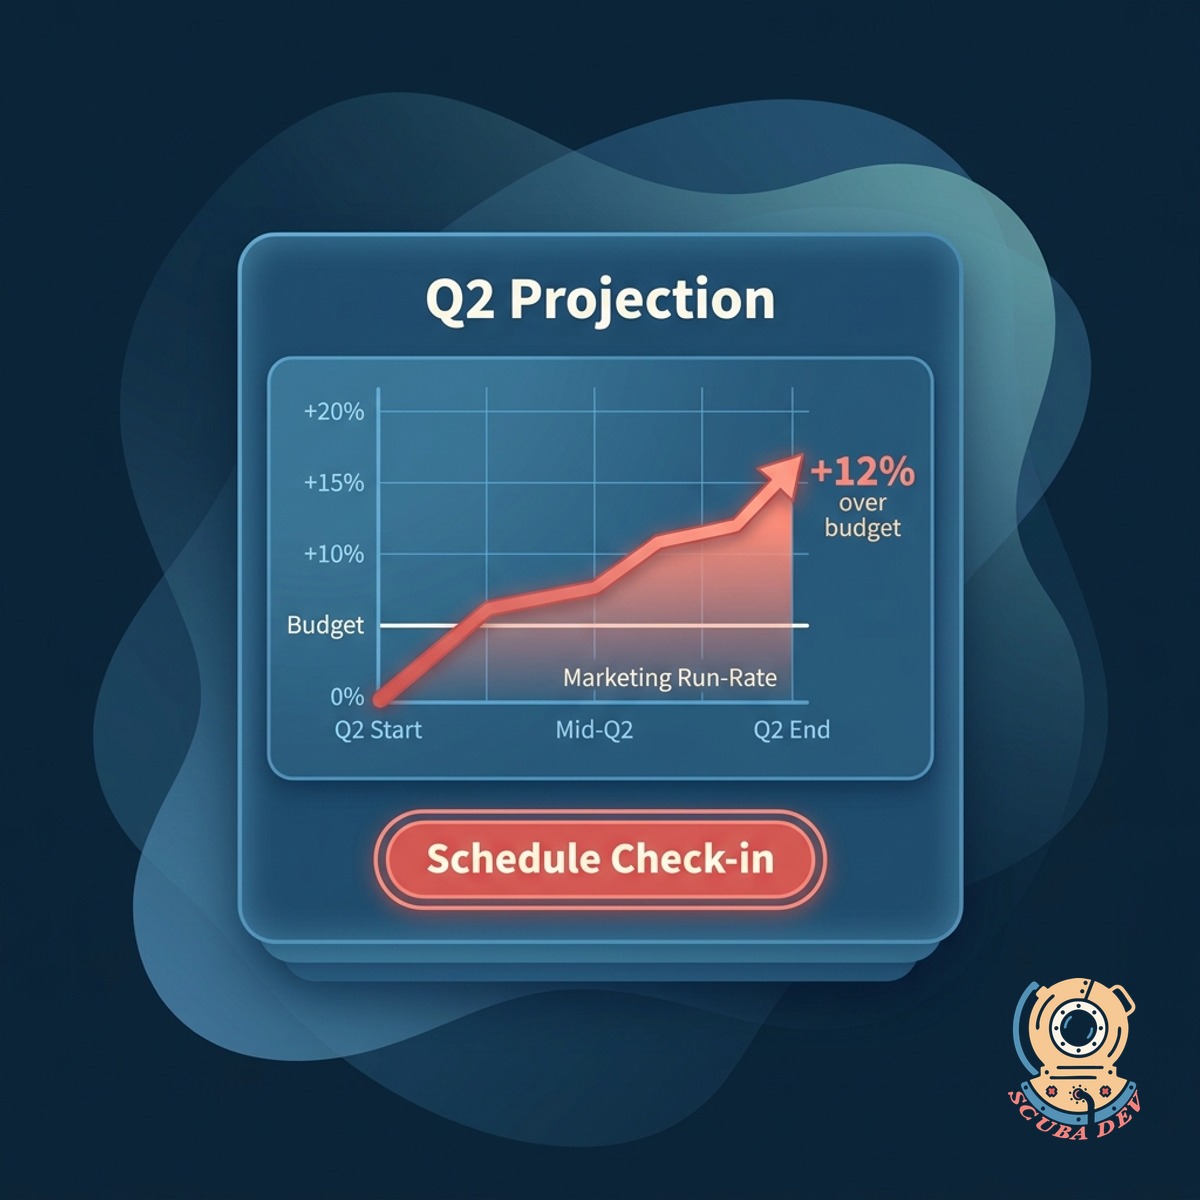
Early Warning On Overruns
Flags departments trending over before the quarter closes. Coral alert, suggested owner, and a scheduled check-in.
- Projects end-of-quarter spend from run rate
- Alerts the department head 30 days before close
- Meeting invite auto-generated with the variance attached
Questions
Things people ask
How is the budget loaded?
Upload your budget sheet during setup. We map it to your chart of accounts and department codes. Re-upload any time the budget changes.
Can department heads see only their slice?
Yes. Role-based permissions show each department head their own budget. Finance and execs see the full roll-up.
How are projections calculated?
Run-rate based on the current pace plus any scheduled recurring costs. You can override with a custom projection for seasonal departments.
What if the GL is messy?
We clean it during onboarding. Unclassified charges land in a review queue instead of hitting the variance math blind. You fix the classification rules and it gets better over time.
Can we compare to prior year?
Yes. Side-by-side with last year, last quarter, or any custom window. Trend lines included.
What about accruals?
Supported. We read your accrued expense accounts and include them in the spend totals. You can toggle accrual view on or off.
Does this replace our FP and A tool?
For most teams, yes. For larger finance orgs using Anaplan or Workday Adaptive, we complement rather than replace, pushing the dashboard data into their tool.