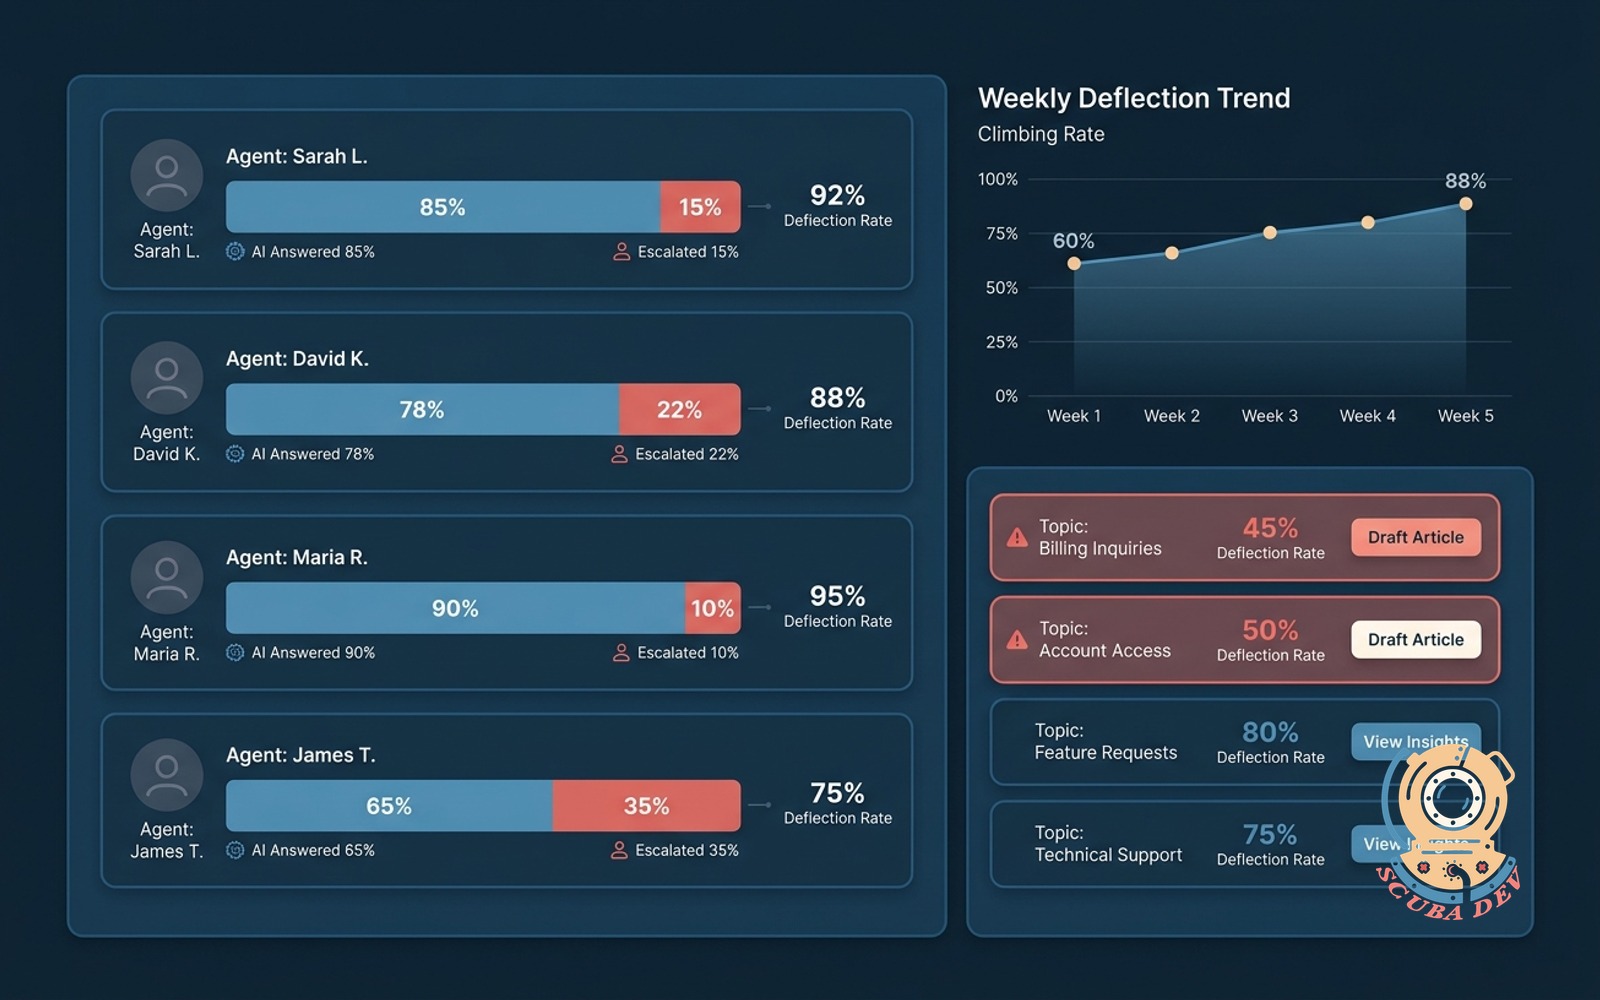
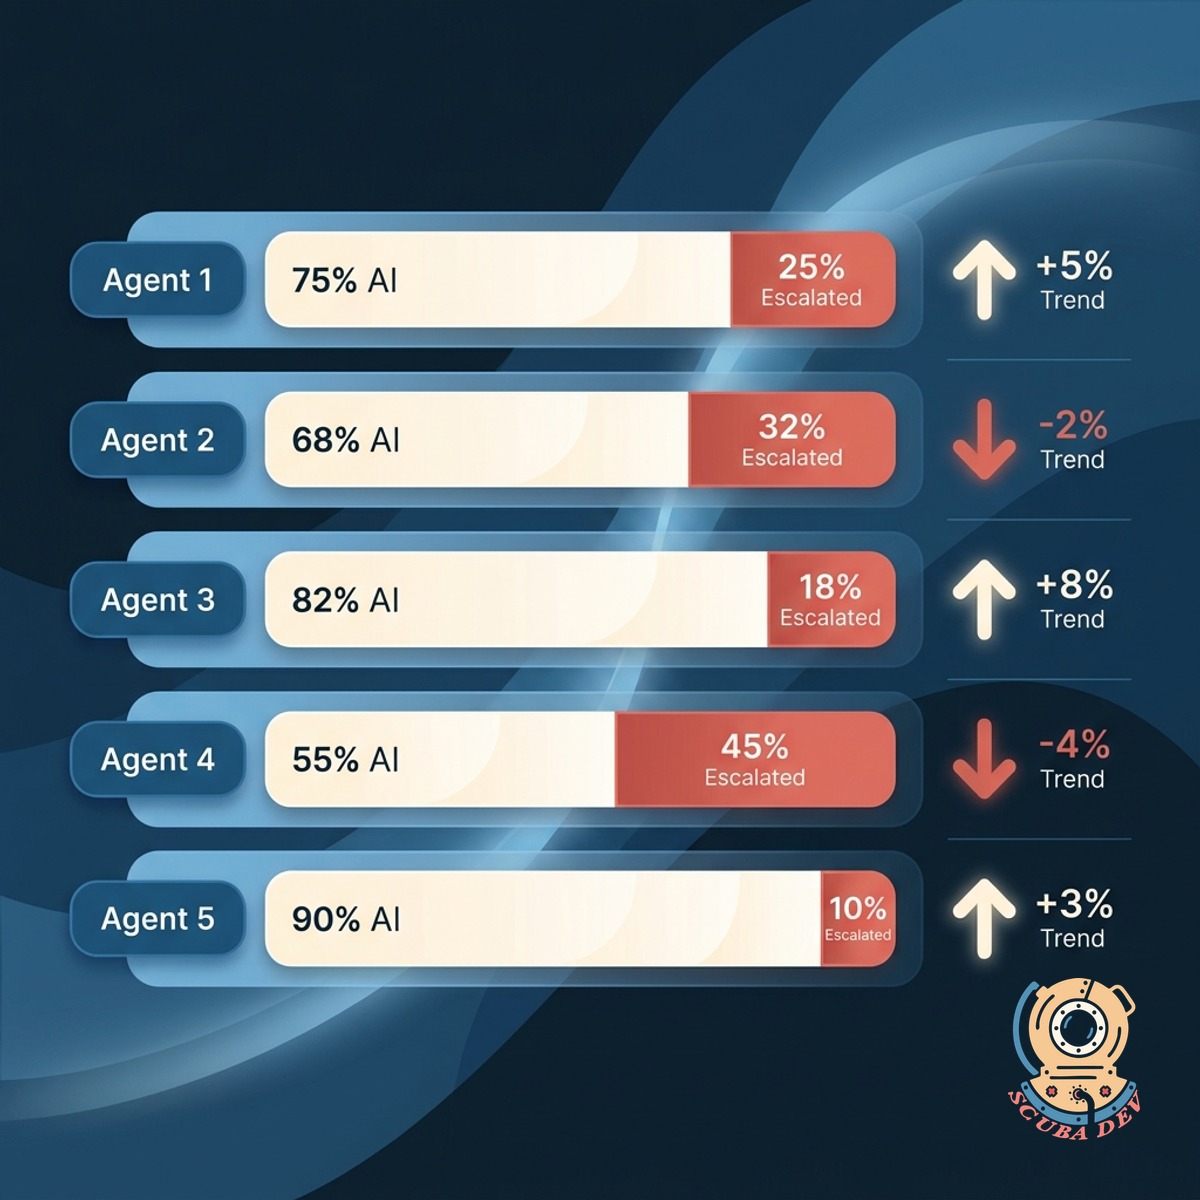
Ticket deflection rate by agent
Tracks what the AI answered versus escalated, per agent and per topic. Shows where to tune the knowledge base.
Possibilities
Where this could go
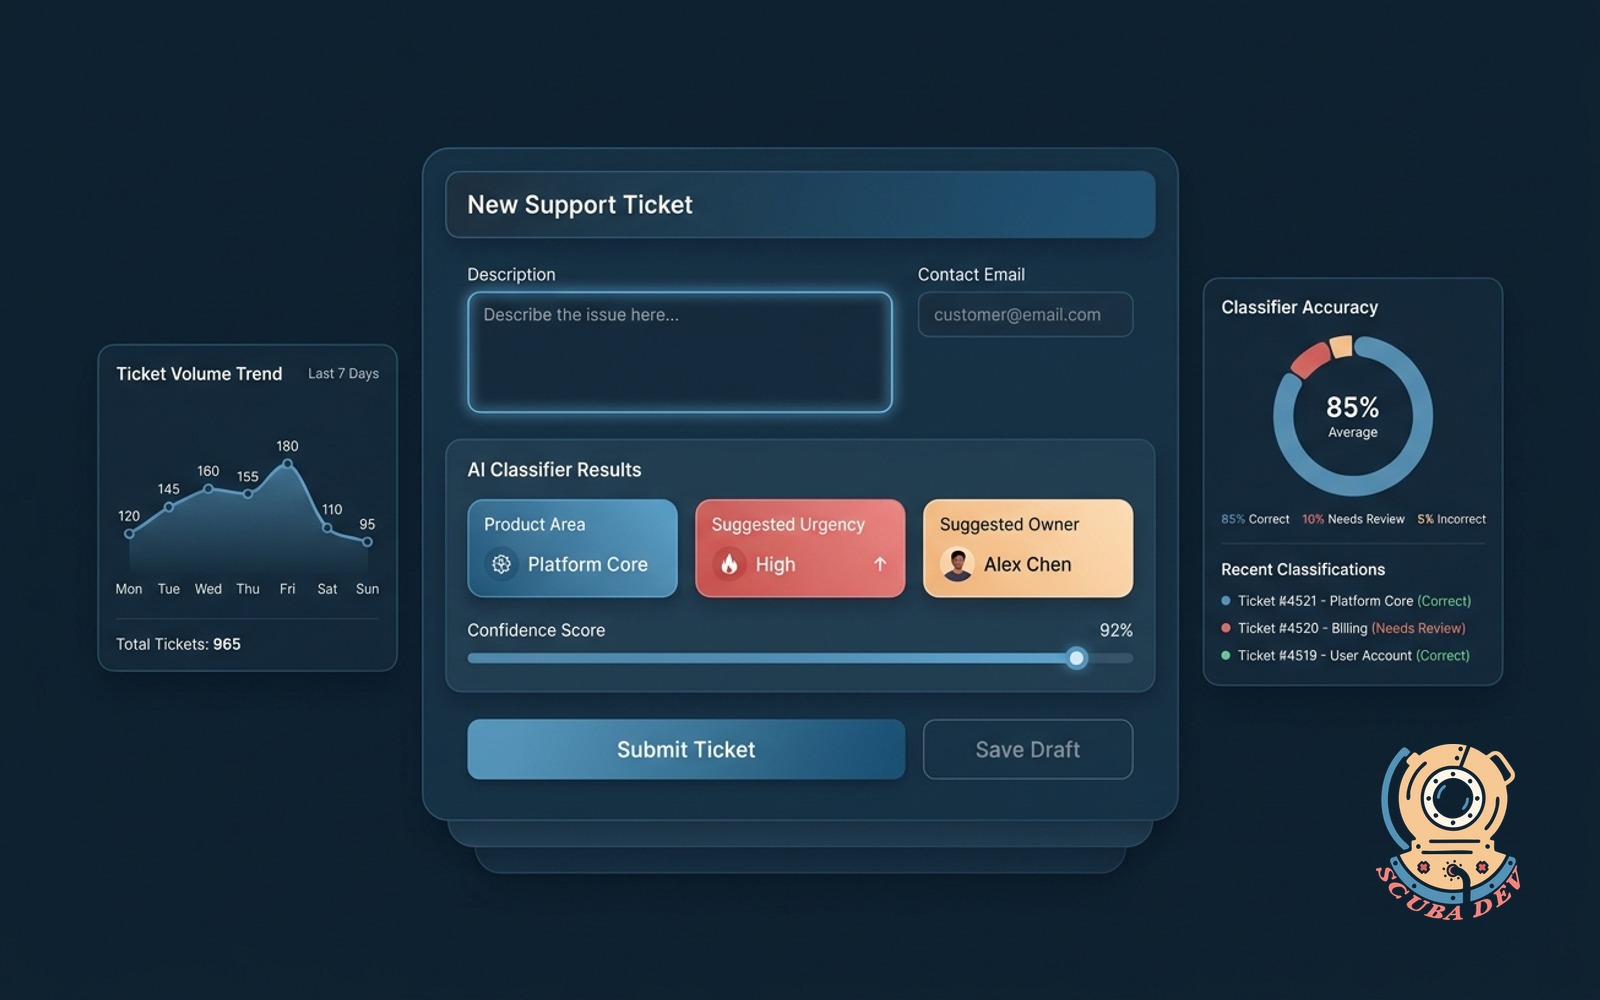
What The AI Handles
Every ticket shows whether the AI answered, the agent took over, or it was escalated. You see the deflection rate by agent and by topic.
- AI-answered versus human-answered percentages
- Deflection rate by agent for coaching
- Deflection rate by topic for knowledge tuning
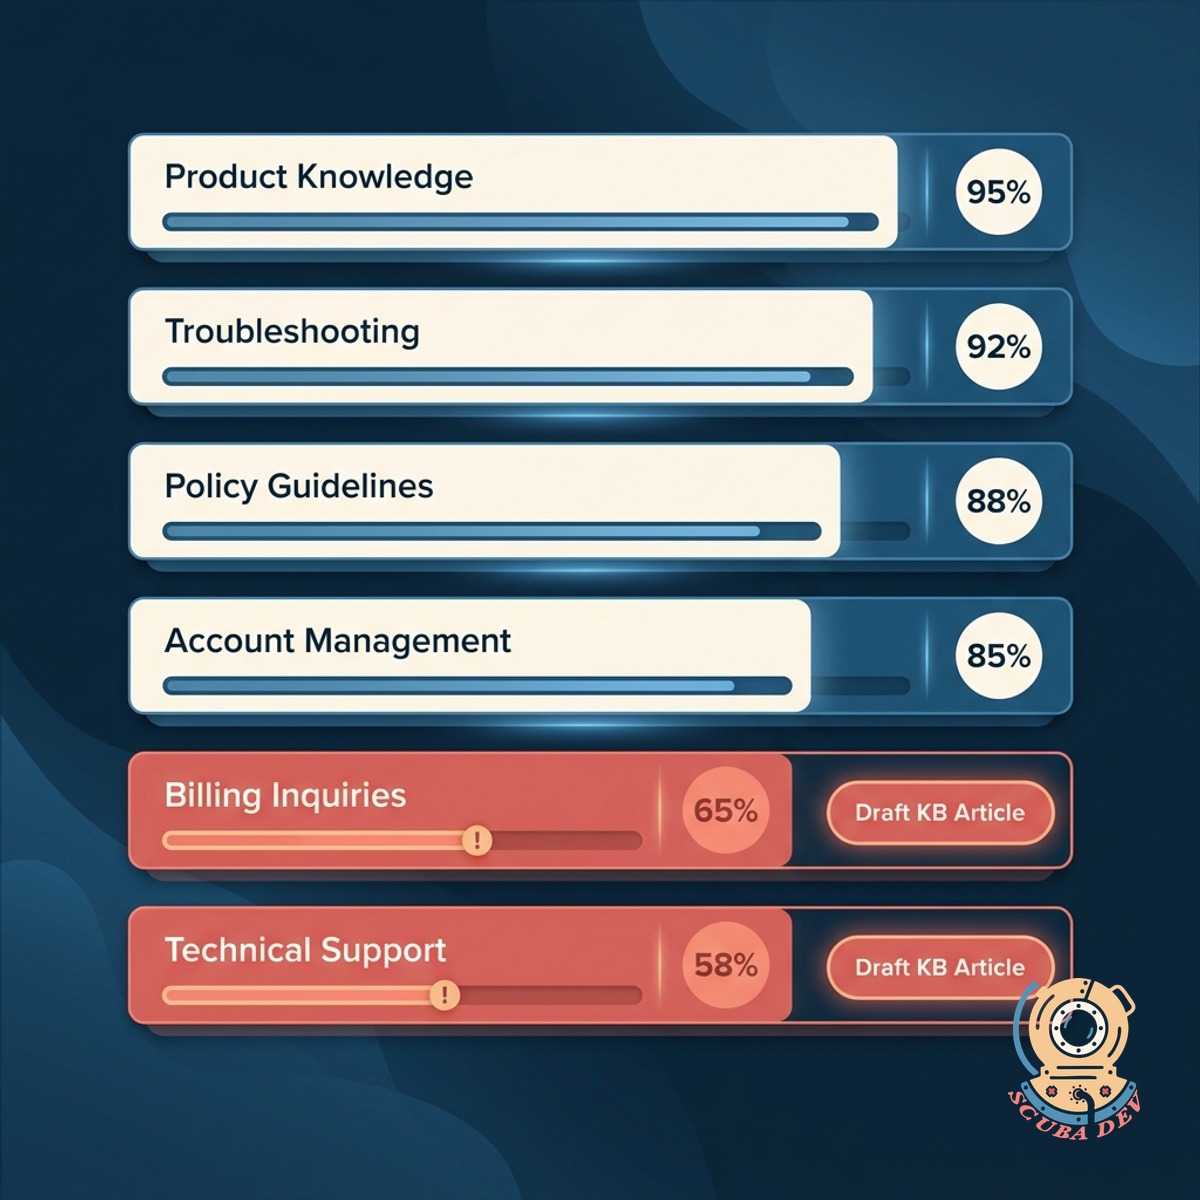
Topic-Level Tuning
See which topics the AI nails and which it keeps missing. The dashboard surfaces topics that need knowledge base additions.
- Topic-level accuracy ranked from best to worst
- Suggested knowledge base articles for weak topics
- Link to draft the article in the same flow
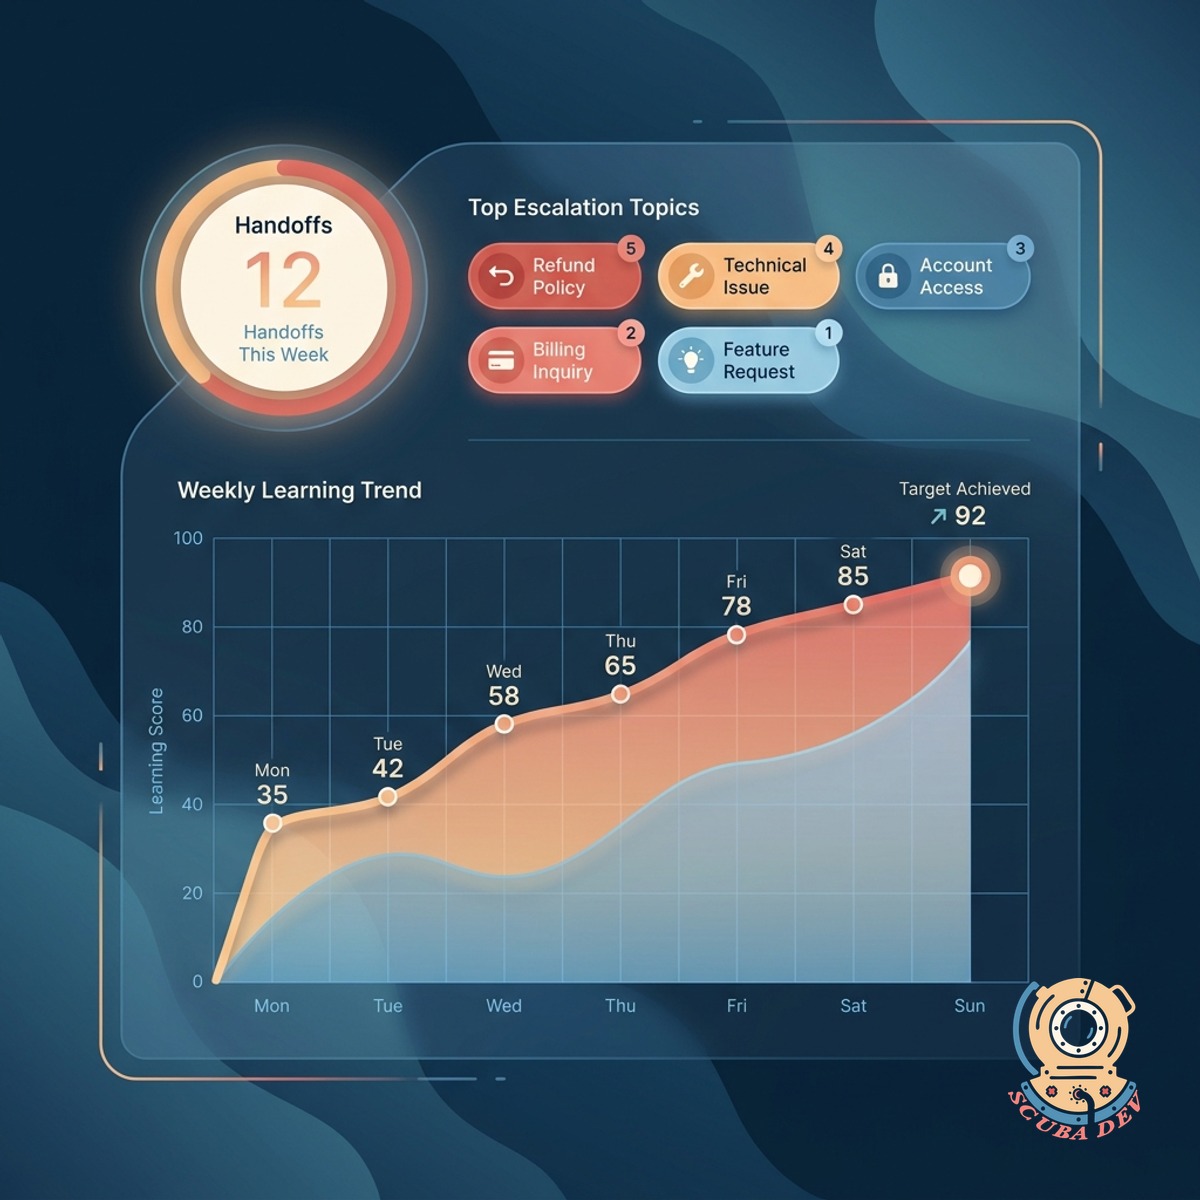
Coaching Without Guesswork
Each agent gets a personal dashboard showing where the AI needed their handoff and what they did with it. Turns every ticket into a learning moment.
- Agent-specific view with handoff history
- Patterns called out for coaching conversations
- One-click add to a shared knowledge base
Questions
Things people ask
Which ticketing systems work?
Zendesk, Intercom, Freshdesk, HubSpot Service Hub, Help Scout, Gorgias, and Kustomer. The dashboard reads ticket events and AI responses directly.
Which AI assistants does this work with?
Most built-in AI resolvers including Intercom Fin, Zendesk AI, Ada, Forethought, and custom LLM-based setups. We map the handoff signal so the dashboard knows when human picked up.
How is accuracy measured?
When the AI resolves and the customer does not reopen within seven days, we count it accurate. When the agent had to correct or rewrite the AI response, we count it as a near-miss.
Can we see trends over time?
Yes. Week, month, or custom window. As you improve the knowledge base, you see deflection climb and cost per ticket drop.
Does this help us write better KB articles?
Yes. The weak topics come with a suggested draft based on the ticket resolutions your team shipped. You edit, approve, and publish. Deflection on that topic climbs within the next week.
What about customer satisfaction?
CSAT flows in per ticket type and per resolver (AI or human). Sometimes AI deflection is high but satisfaction tanks. The dashboard shows both so you can balance.
Does this replace our QA process?
It gives your QA lead the coverage data they need. Manual reviews still happen for edge cases. Most teams shift from blanket sampling to targeted review based on what the dashboard flags.