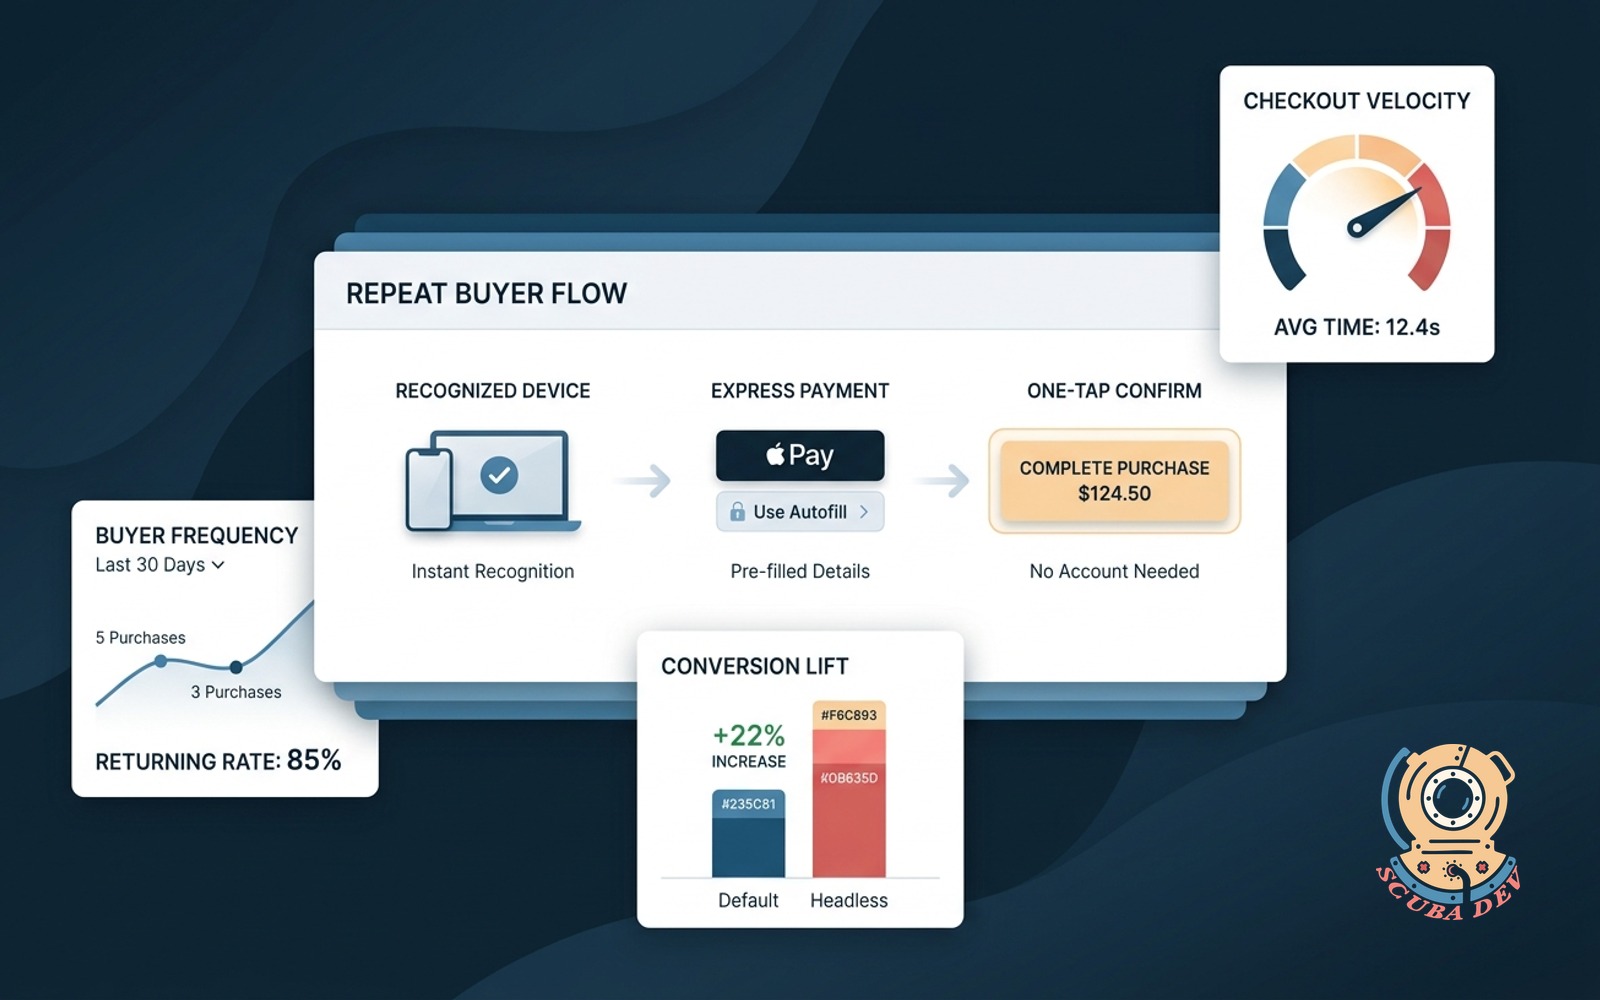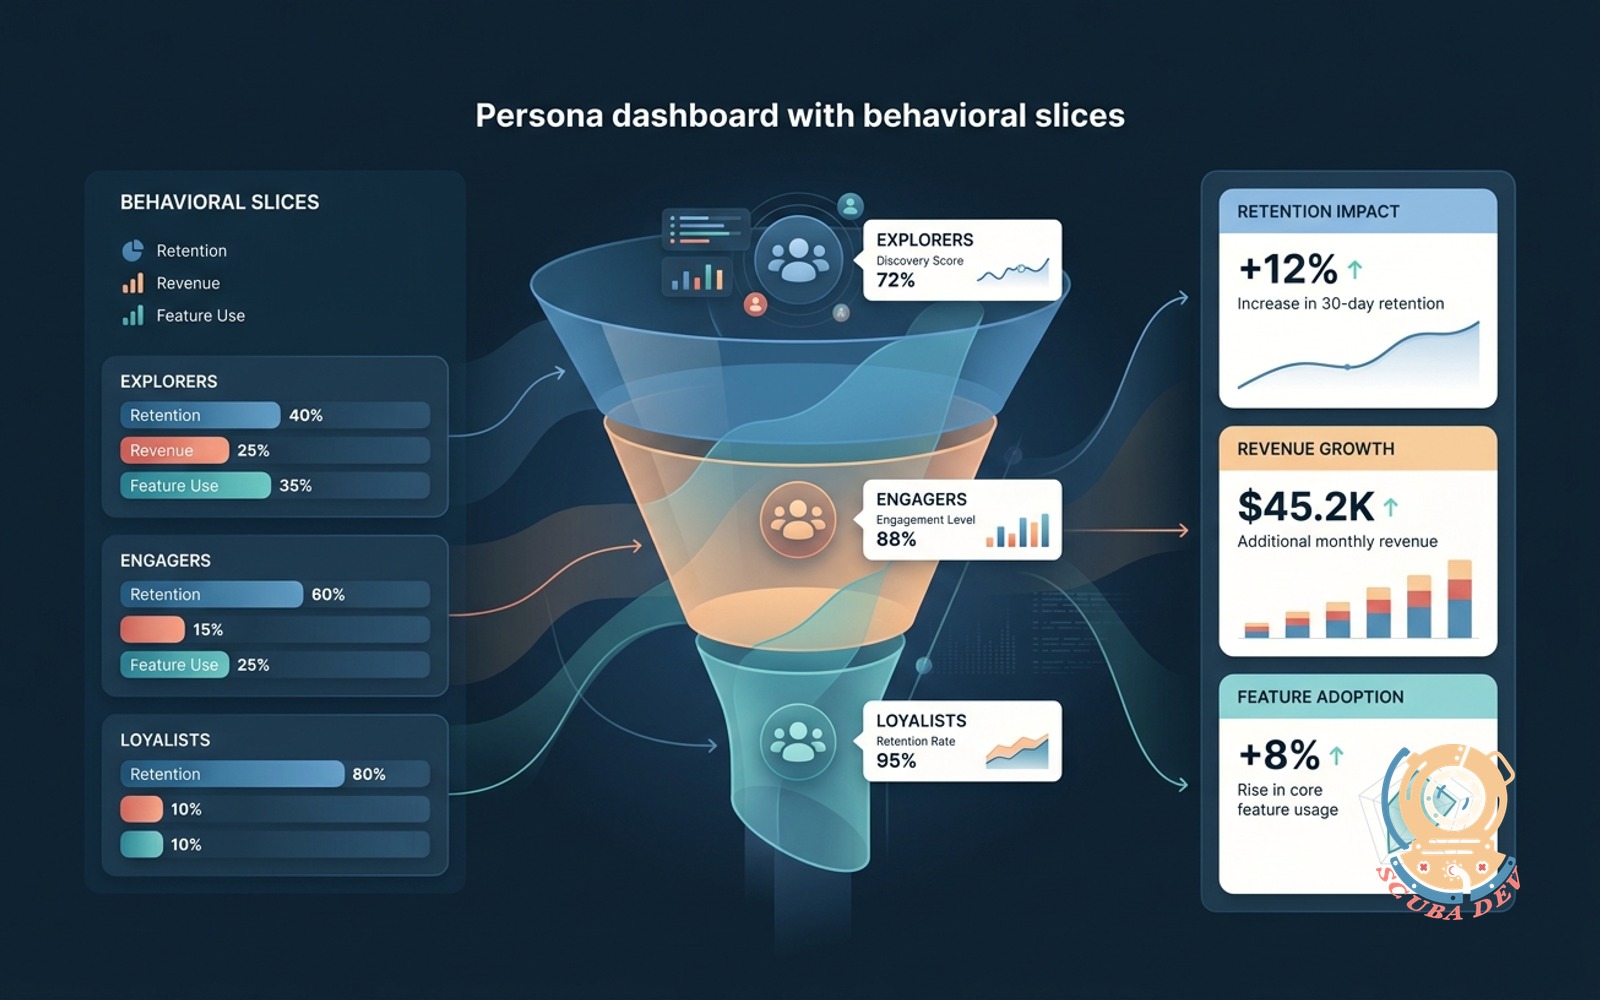
Persona dashboard with behavioral slices
Defines personas by behavior, not guesswork. Slices retention, revenue, and feature use per persona.
Possibilities
Where this could go
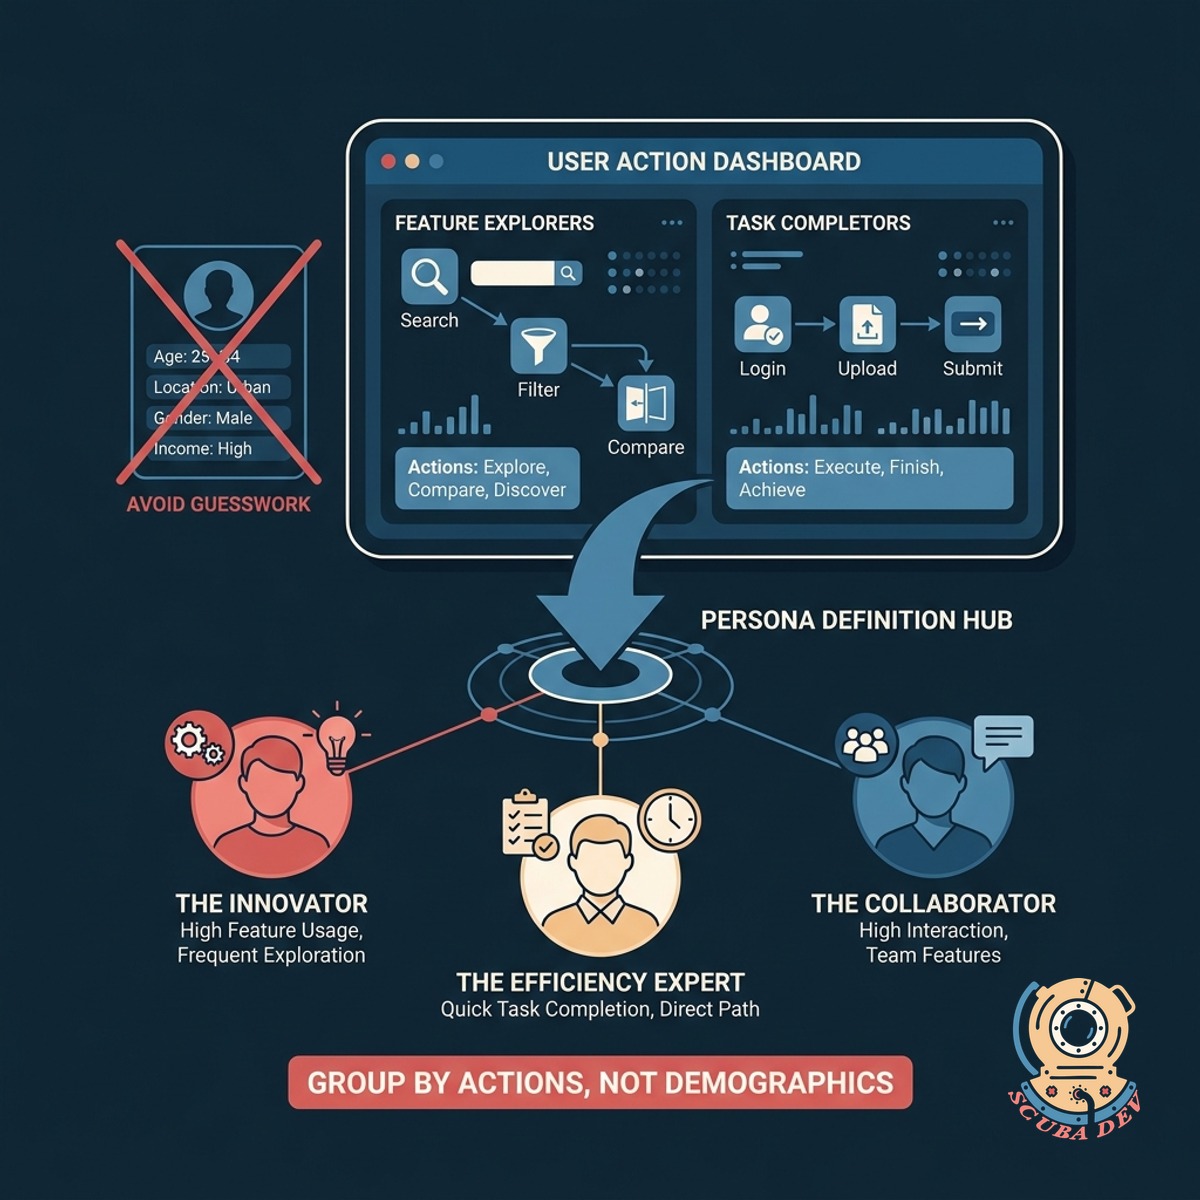
Define Personas By Actual User Actions
Group your users based on the features they use and the actions they take instead of relying on demographic guesswork.
- Track specific feature usage
- Group users by activity levels
- Identify core behavioral traits
- Eliminate demographic assumptions
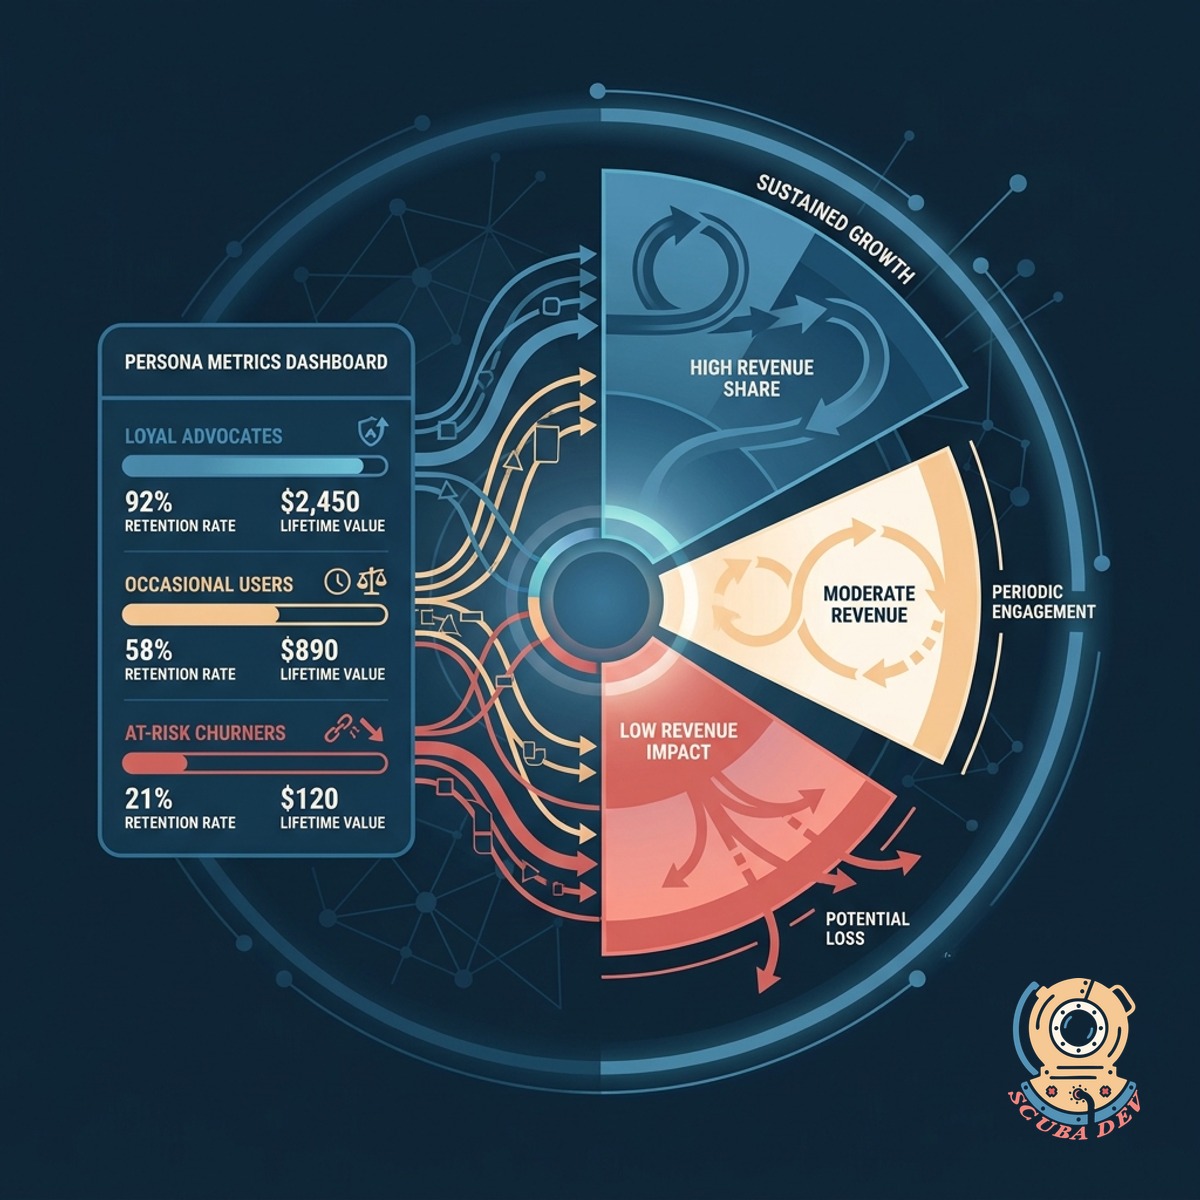
Slice Retention And Revenue By Persona
Measure how different behavioral segments impact your business by tracking their specific retention rates and lifetime value.
- View retention curves per group
- Analyze lifetime value by segment
- Compare subscription tiers
- Monitor churn risk by behavior
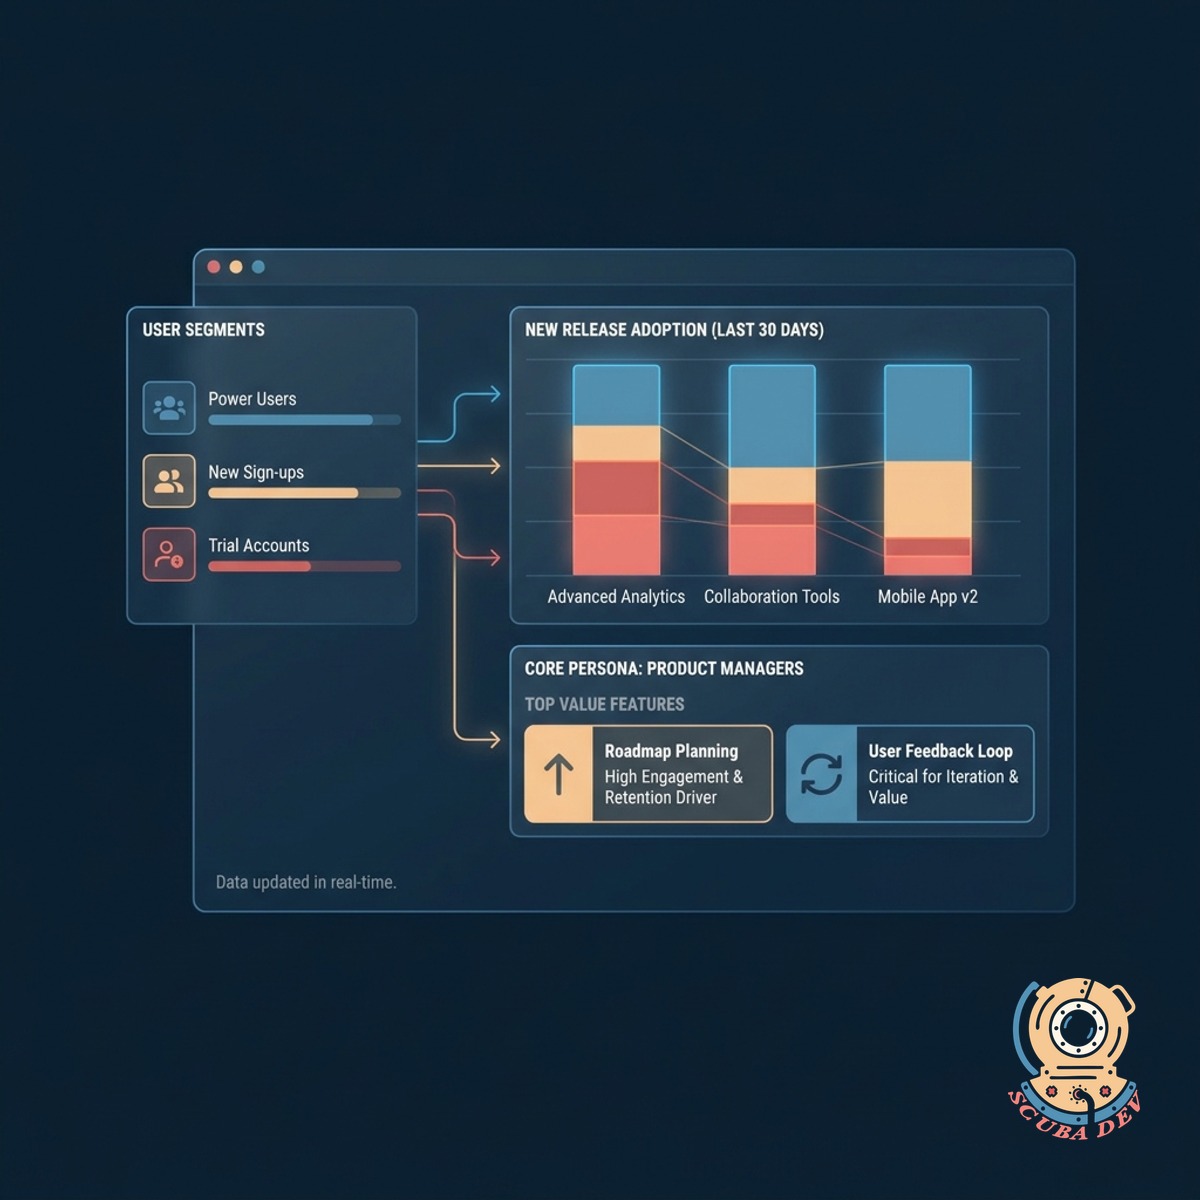
Track Feature Adoption Across User Groups
See exactly which segments engage with new releases and which features drive the most value for your core personas.
- Monitor new feature engagement
- Identify unused product areas
- Map feature use to personas
- Guide product roadmap decisions
Questions
Things people ask
How do you define a behavioral persona?
We define personas based on the specific actions users take within your application. Instead of looking at age or job title, we group users by how often they log in, which features they use, and how they navigate your product.
Which analytics tools do you integrate with?
We pull event data from standard product analytics platforms like Amplitude, Mixpanel, and PostHog. We can also connect directly to your application database or data warehouse using tools like Snowflake or BigQuery.
Can we track revenue metrics for these segments?
Yes. We connect your payment processor data from Stripe or Chargebee to your behavioral segments. This allows you to see the exact lifetime value and monthly recurring revenue associated with each persona.
How do we handle users who change their behavior over time?
The dashboard updates dynamically as user actions change. If a casual user increases their activity and meets the criteria for a power user persona, their metrics will automatically shift to the new segment.
Is it possible to see retention curves for specific features?
The dashboard allows you to filter retention data based on interaction with specific features. You can compare the retention rates of users who adopted a new feature against those who ignored it.
How long does it take to set up the behavioral slices?
The timeline depends on the current state of your event tracking. If your event taxonomy is already clean in a tool like Mixpanel, we can build the dashboard views in a few weeks.
Can we export this persona data to our marketing tools?
We can set up data syncs to push persona tags back to your customer engagement platforms like Customer.io or Hubspot. This ensures your marketing team can target campaigns based on actual product usage.