NRR and GRR exec dashboard
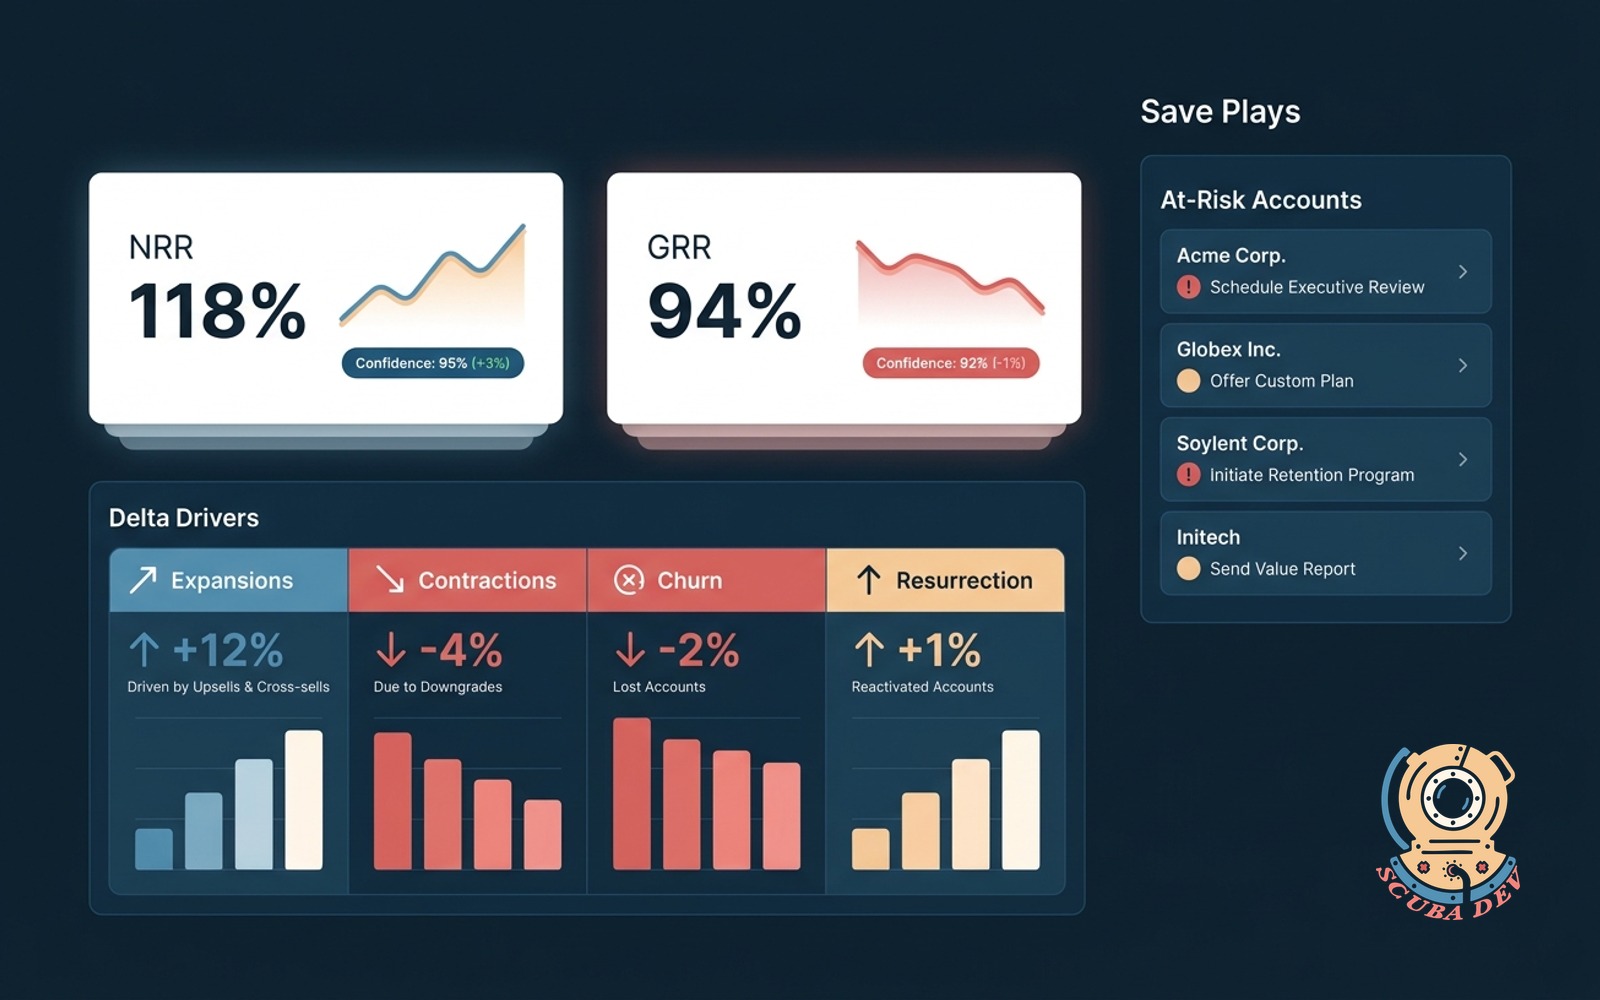
Net and gross retention in one view with the deals driving the delta. Hover for the save plays in flight.
Possibilities
Where this could go

NRR and GRR, One View
Net retention and gross retention in one glance. The board shows the number, the trend, and the confidence behind each.
- NRR and GRR for current quarter and trailing four
- Confidence indicators based on data completeness
- Snapshot history so you can compare across quarters
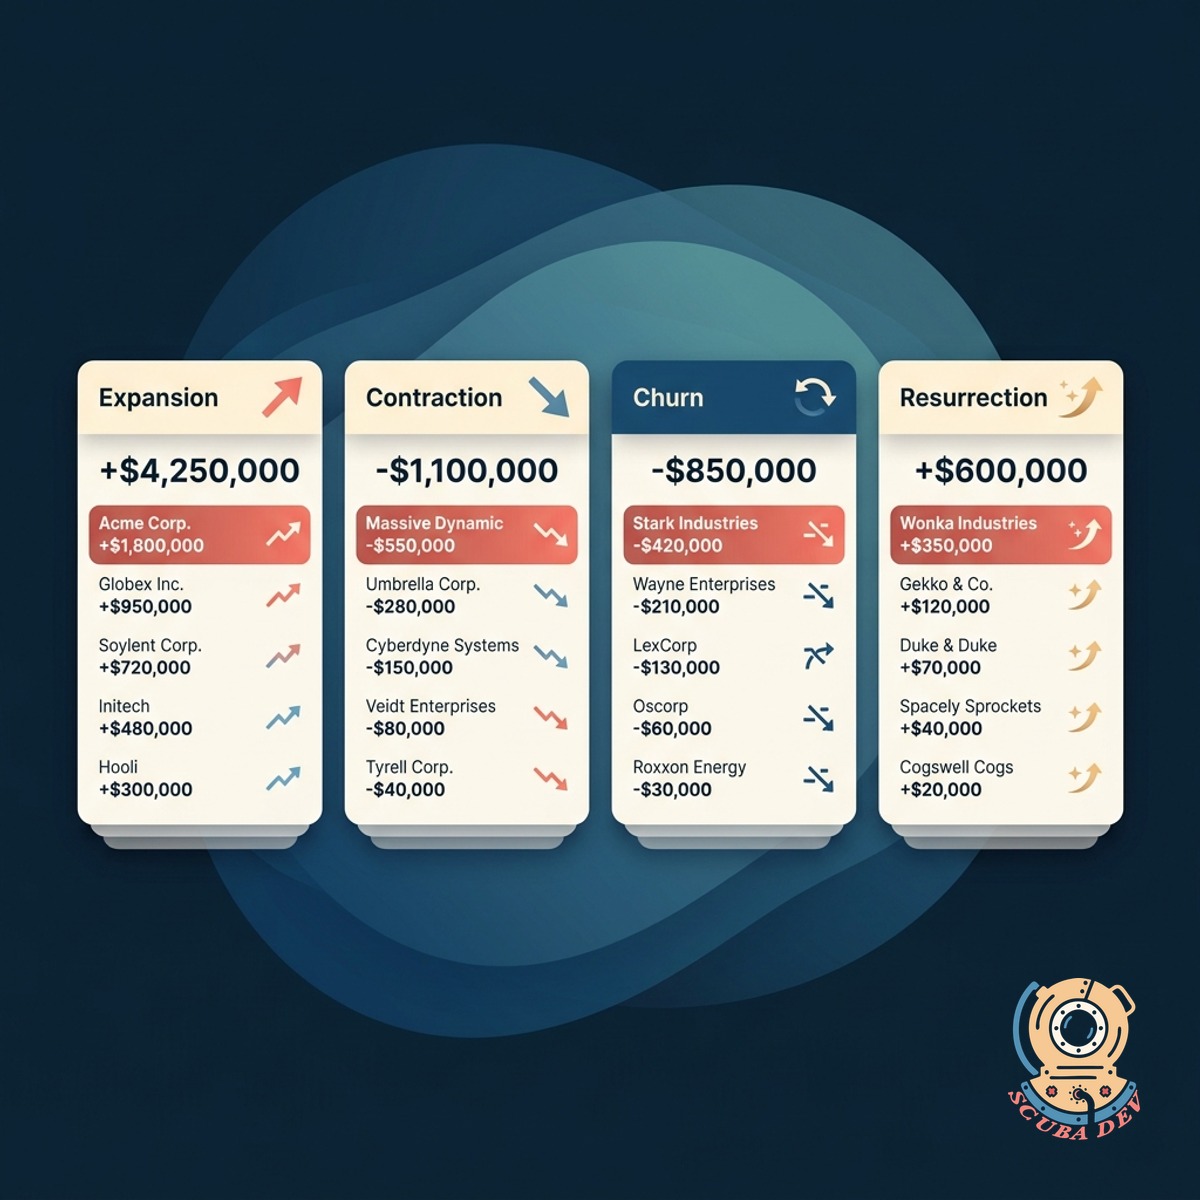
The Deals Driving The Delta
Every expansion, contraction, and churn that moved the number. Hover any delta to see the specific accounts behind it.
- Expansion, contraction, churn, and resurrection tracked
- Accounts behind each delta listed on hover
- Export the delta log for board meetings
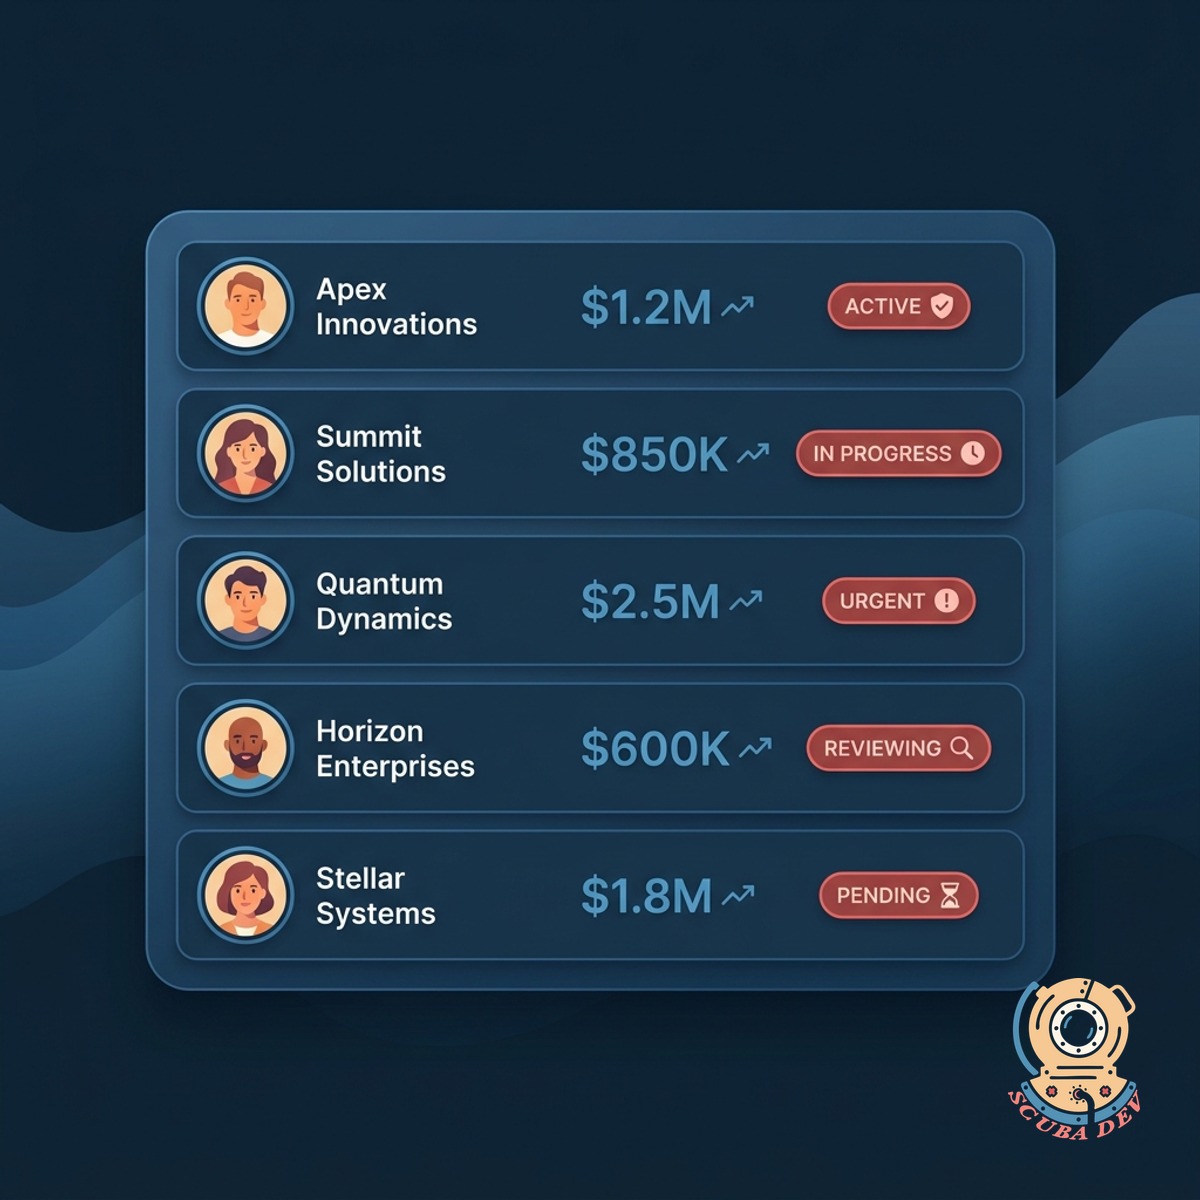
Save Plays In Flight
For accounts on the risk list, the dashboard surfaces the save plays already in motion and what is still needed.
- Save plays by account with status and owner
- Flags accounts with no active save play
- Aggregates save play conversion rate for playbook tuning
Questions
Things people ask
How is NRR calculated?
Revenue from the starting cohort plus expansions minus contractions and churn, divided by starting revenue. Pulled from Stripe, Chargebee, or your billing system.
How fresh is the data?
Updated overnight. You can trigger a manual refresh if a big deal lands mid-week. Final-of-quarter snapshots lock at close.
Can we segment NRR?
Yes. By segment, product, region, or cohort. Executives usually want a top-line NRR plus NRR by segment for board reporting.
How do save plays connect?
Save plays live in your CS platform (Gainsight, ChurnZero, Catalyst, or a CRM). We read the play status and display it alongside the at-risk account.
Can we share this with the board?
Yes. Board-ready export with a branded PDF, an interactive share link, or a push into your board portal. The numbers stay current as you approach the meeting.
What counts as resurrection?
A previously churned account returning within 12 months. You can adjust the window. Resurrection revenue shows separately so NRR and GRR are not inflated.
Does this replace our BI tool?
No. This is a focused retention view for the exec team. Your BI tool still owns broader analysis. We push clean retention data into your BI if needed.