Landing page A/B test dashboard
Tracks every live test with statistical significance, revenue lift, and a clear call on what to ship.
Possibilities
Where this could go
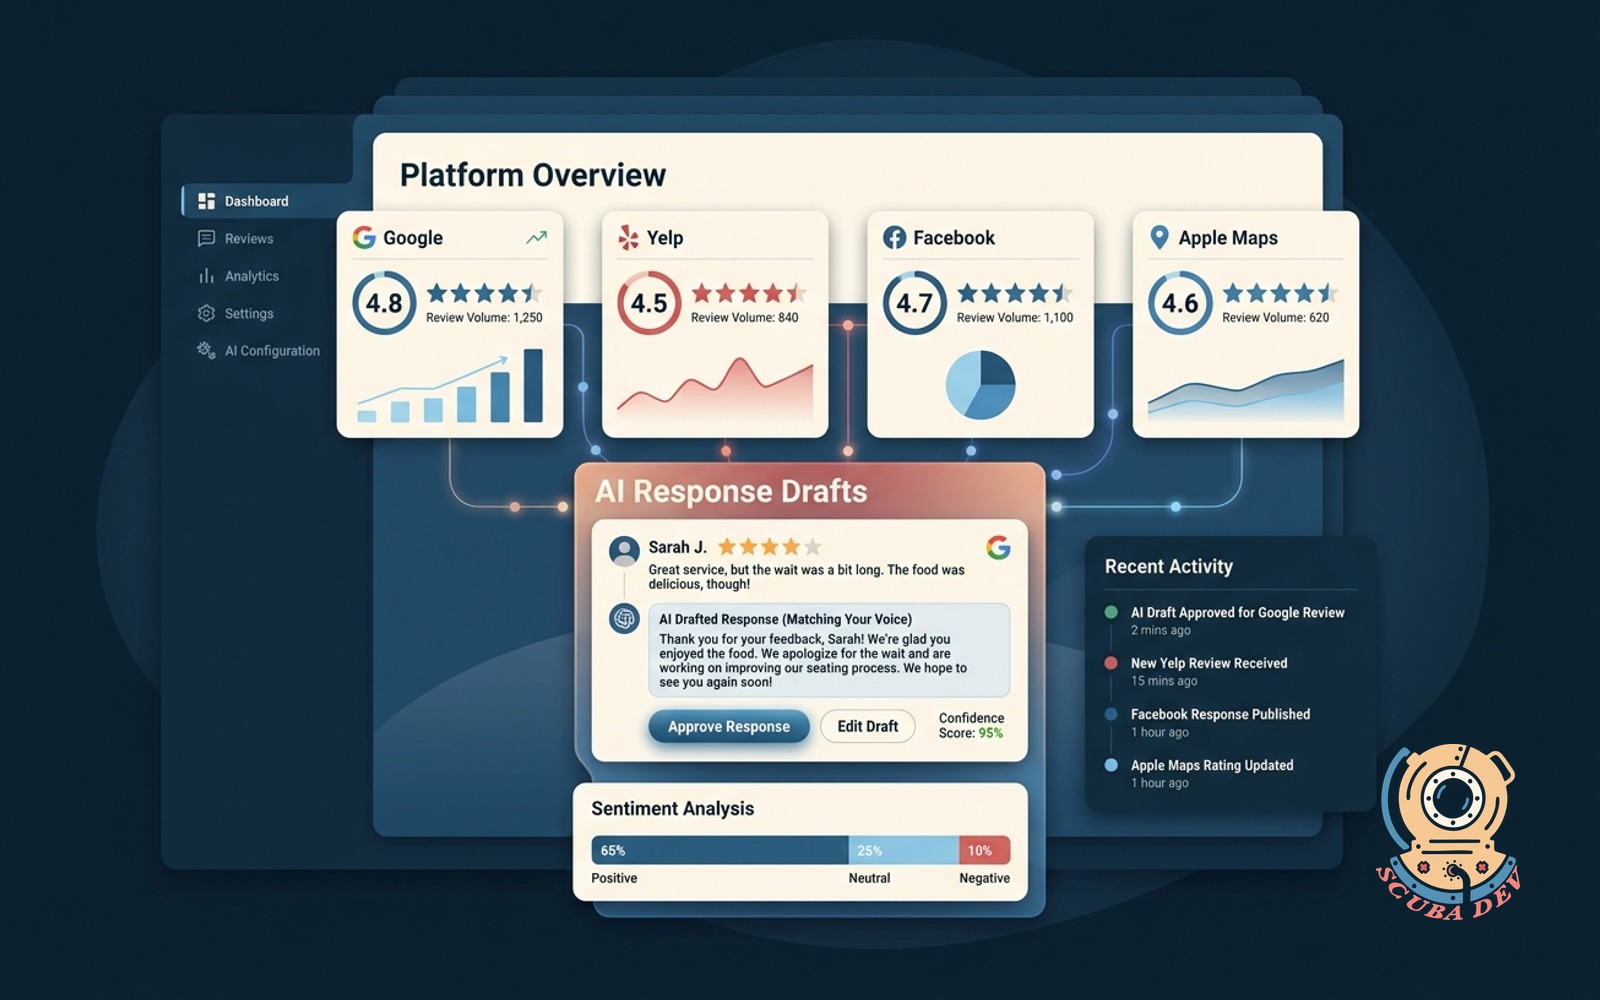
Every Live Test In One View
Every active A/B test across landing pages, pricing, and forms in one dashboard. Status, variant counts, and progress at a glance.
- Tests from Optimizely, VWO, Convert, Google Optimize, or custom setups
- Status per test: running, significant, needs more traffic, stopped
- Quick view of what is being tested and on which page
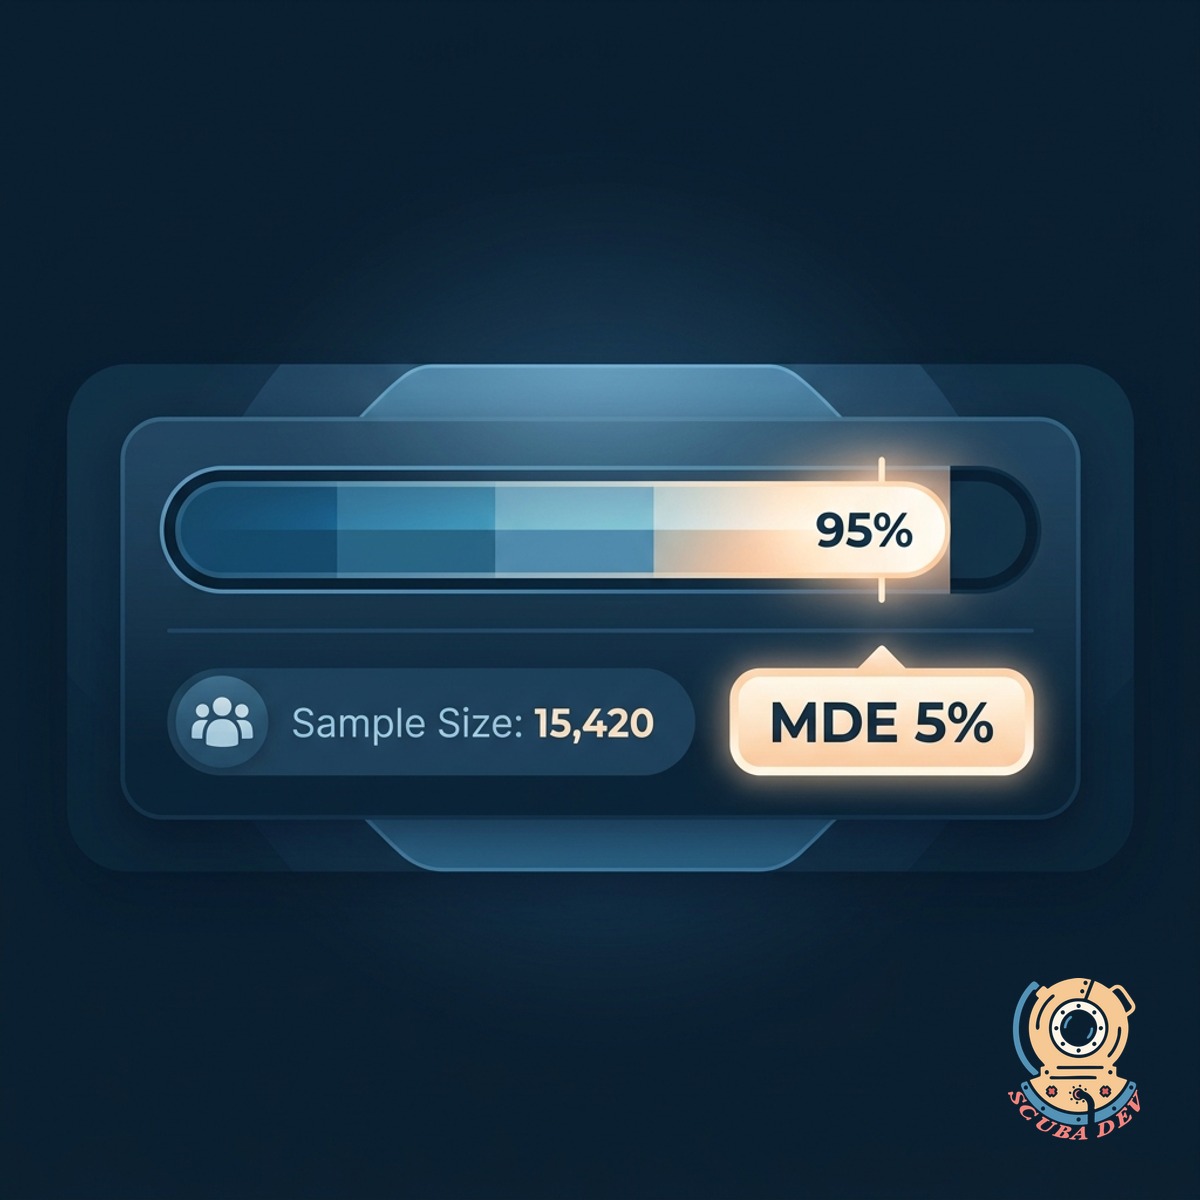
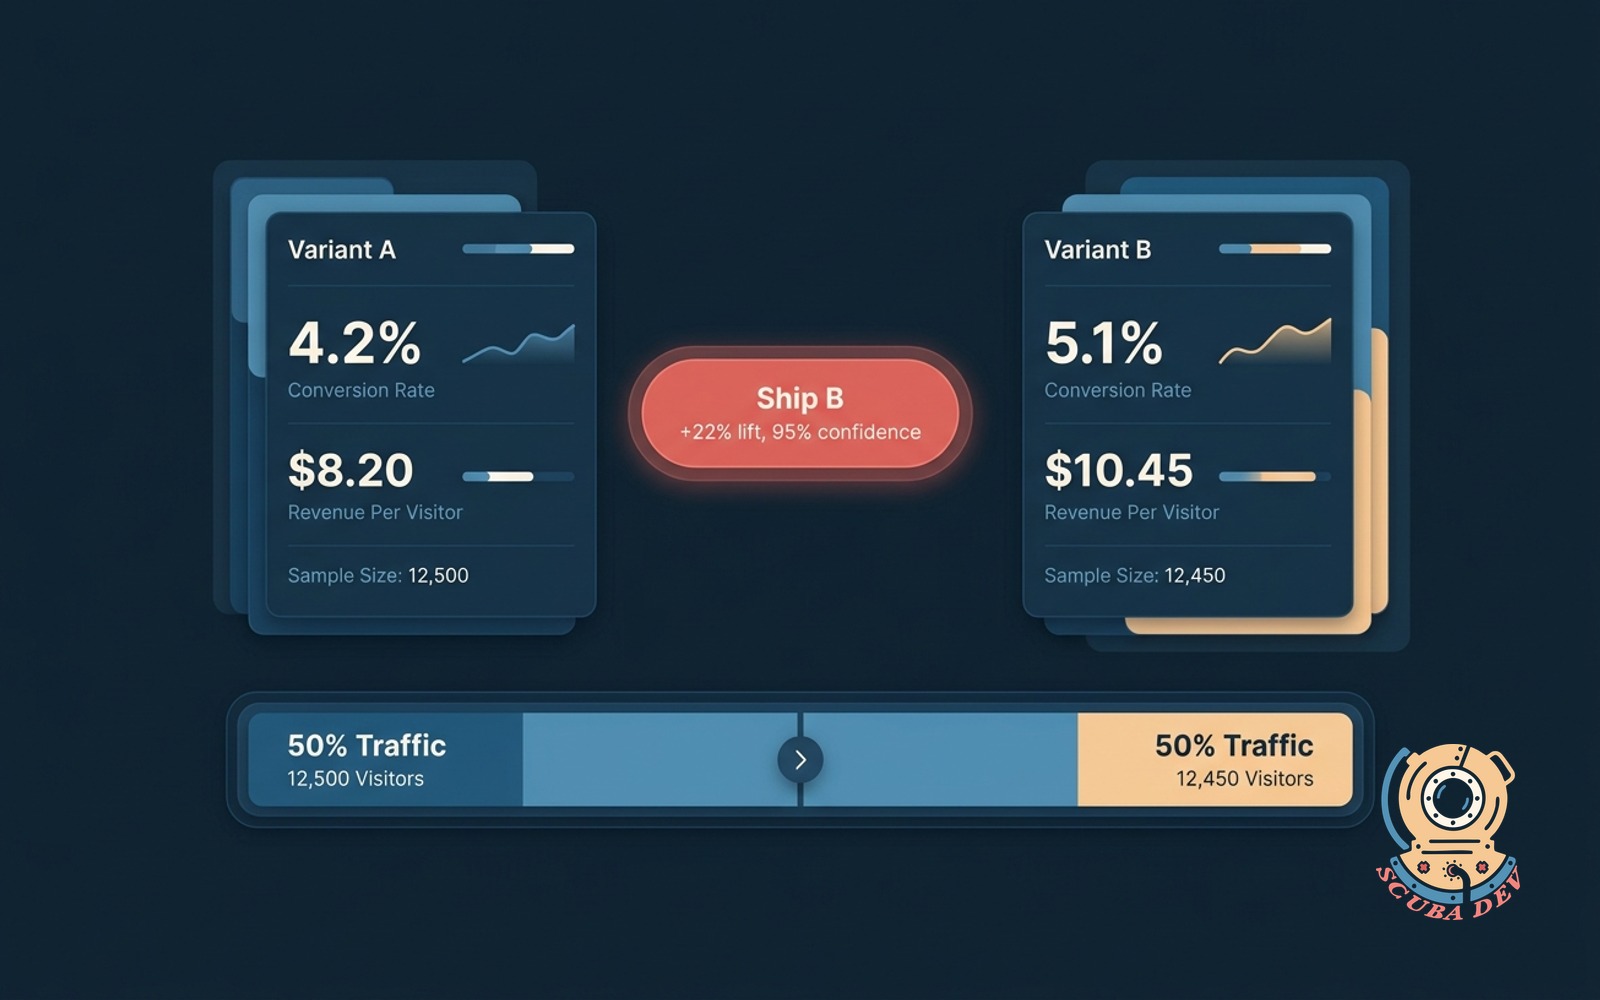
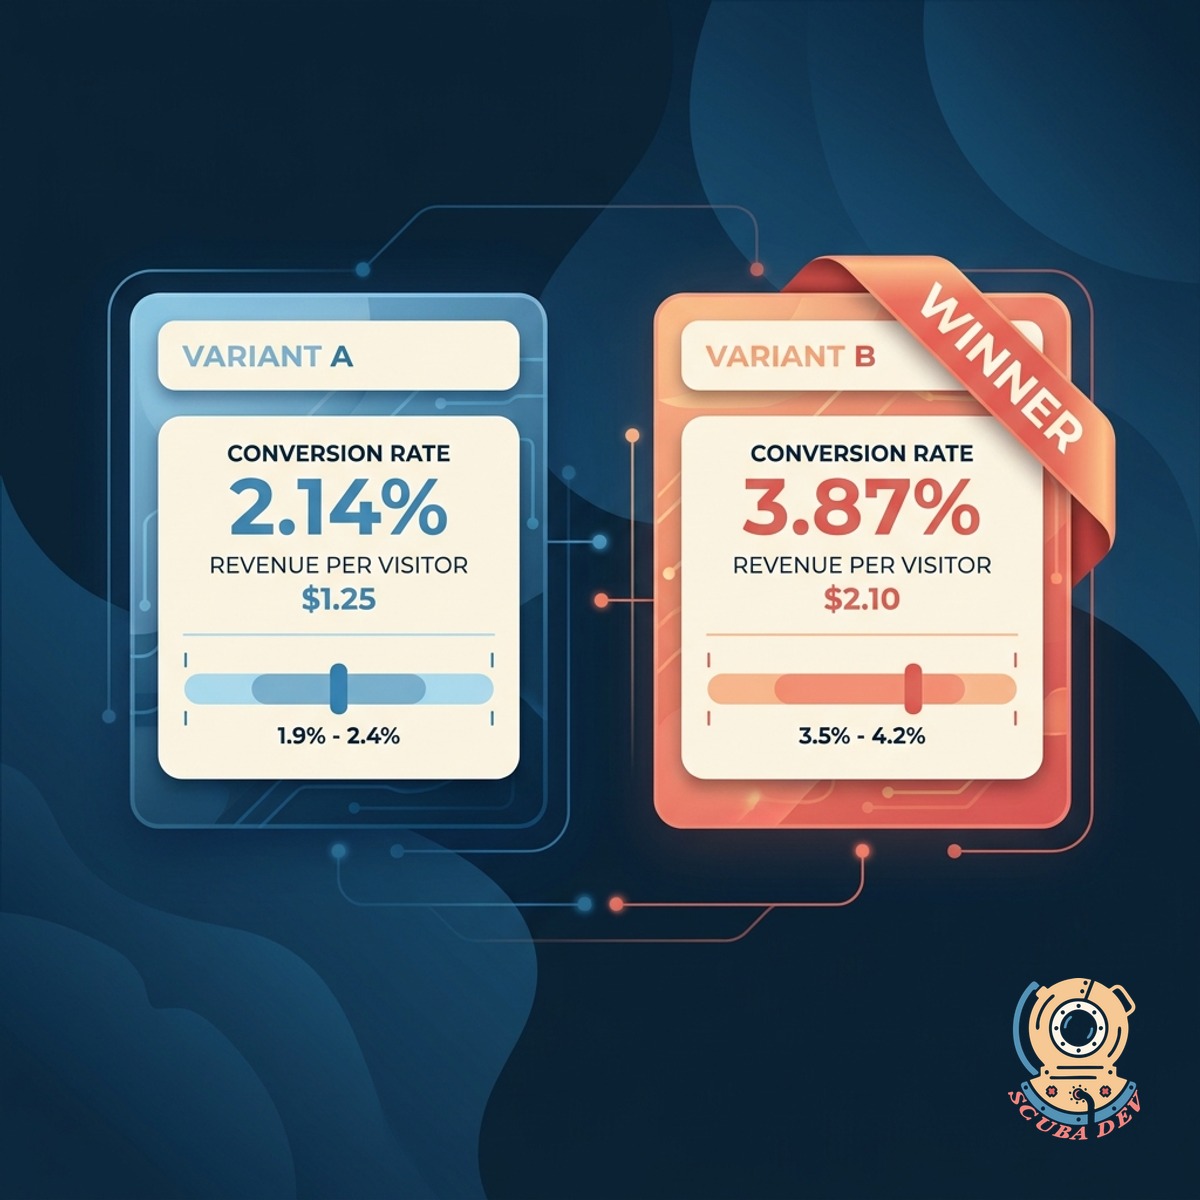
Significance You Can Trust
Every test shows statistical significance, confidence intervals, and sample size. No more shipping winners that were actually noise.
- Significance calculated with your minimum detectable effect
- Confidence intervals shown on every variant
- Traffic allocation and sample size tracked per variant
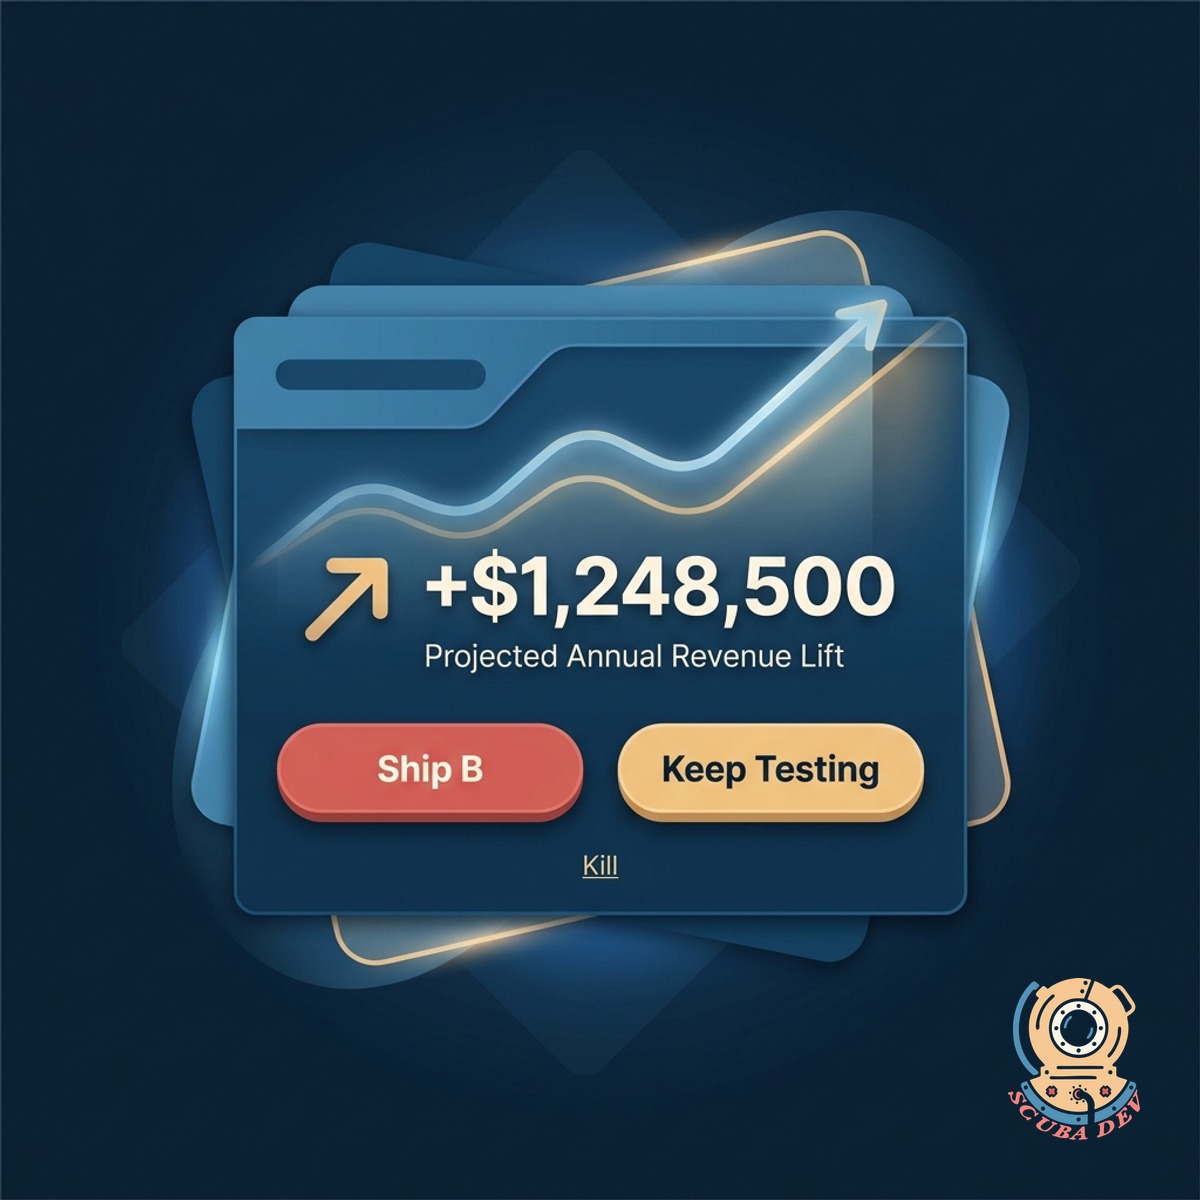
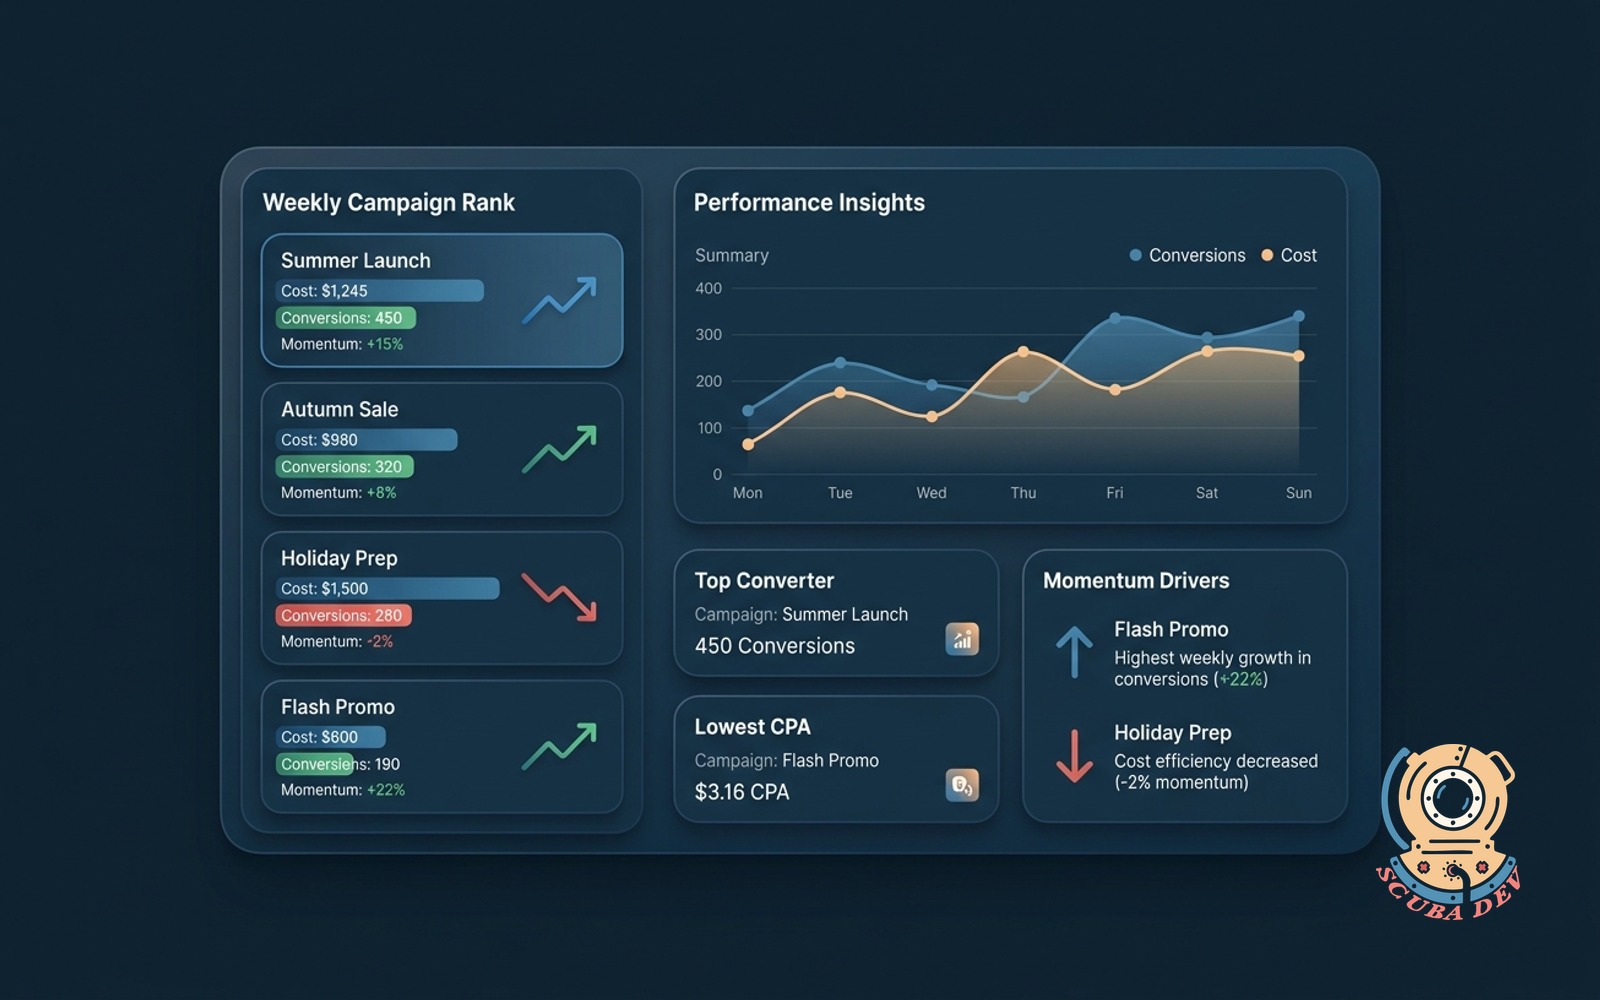
Revenue Lift, Not Just Clicks
Tied to revenue, not just the click. The dashboard shows the projected annual lift if you ship, based on your traffic mix.
- Revenue per visitor, not just conversion rate
- Projected annual lift with confidence range
- Clear call: ship, keep testing, or kill
Questions
Things people ask
Which testing tools connect?
Optimizely, VWO, Convert, Google Optimize (legacy), AB Tasty, Kameleoon, GrowthBook, PostHog feature flags, and Statsig. Custom backend tests with a data feed also work.
How do you calculate significance?
Frequentist by default with your configured minimum detectable effect and alpha. Bayesian mode available. The calculation is shown so your data team can audit it.
How do you tie tests to revenue?
We join test exposure data with your revenue events from Stripe, Chargebee, or your data warehouse. Revenue per visitor for each variant surfaces automatically.
Can non-technical team members read this?
Yes. The recommendation is a clear ship or hold call. Statistical details are available on click for anyone who wants to dig in.
What about tests with multiple winners?
If multiple variants beat control significantly, the dashboard highlights the biggest lift and suggests shipping that one. You can also run follow-up head-to-head tests from inside the tool.
Can we track holdout groups?
Yes. Users in the holdout never see any test variant. Revenue and retention are measured against the holdout to confirm program-level impact over time.
Does this handle mobile app tests?
Yes. Firebase, Statsig, LaunchDarkly mobile SDK, and custom native tests all flow in. The dashboard shows web and mobile tests side by side.